Figure 4.

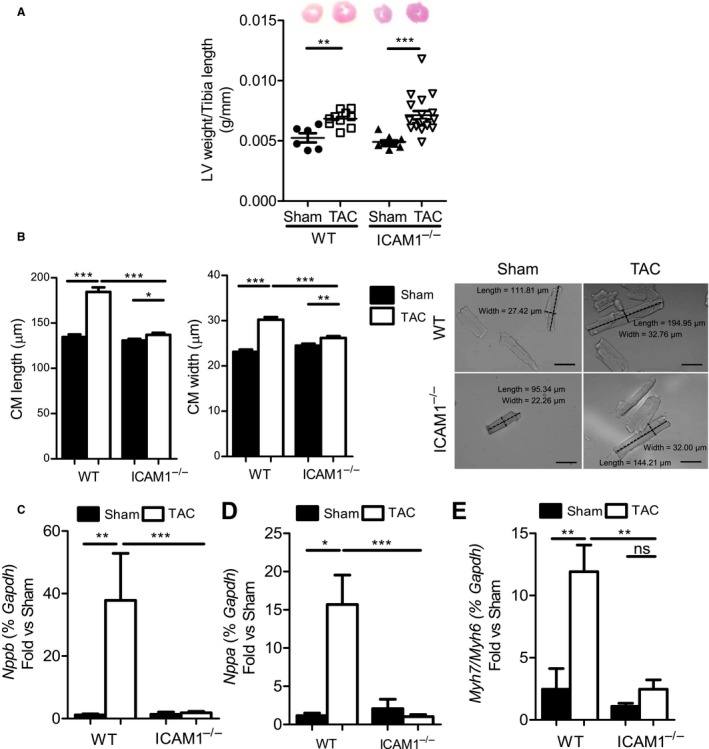
LV weight, CM dimensions, and expression of natriuretic peptides and MHC isoforms in response to TAC in ICAM1−/− mice. A, LV weight of WT and ICAM1−/− (n=6–9 sham, n=10–14 TAC) at 4 weeks after TAC, normalized to the tibia length. B, Dimensions of CMs isolated from WT and ICAM1−/− mice at 4 weeks after TAC or sham surgery. n=100 to 200 cells per group, from 2 independent CM isolations. Representative pictures are shown (magnification ×20). Scale bar=50 μm. Statistical analysis used the unpaired t test. C through E, Quantitative reverse transcription polymerase chain reaction of the hypertrophy markers (C) BNP and (D) ANP and the (E) ratio of MHCβ and MHCα. mRNA expression normalized to sham in the LV in response to TAC (n=7) or sham (n=5) surgery at 4 weeks. Statistical analysis used the nonparametric Mann–Whitney test. Data are shown as median (interquartile range): for BNP: WT sham 1.190 (0.508–1.876) and WT TAC 18.60 (6.985–91.82), ICAM1−/− sham 0.682 (0.502–2.921) and ICAM1−/− TAC 1.516 (1.168–2.236); for ANP: WT sham 1.268 (0.519–1.709) and WT TAC 14.33 (5.885–23.92), ICAM1−/− sham 1.273 (0.264–4.664) and ICAM1−/− TAC 0.6279 (0.509–1.797); for MHCβ/MHCα: WT sham 0.557 (0.416–2.395) and WT TAC 10.87 (8.446–14.01), ICAM1−/− sham 1.168 (0.600–1.521) and ICAM1−/− TAC 1.454 (1.045–3.935). *P<0.05, **P<0.01, ***P<0.005. ANP indicates atrial natriuretic peptide; BNP, brain natriuretic peptide; CM, cardiac myocyte; ICAM1, intercellular cell adhesion molecule 1; LV, left ventricle; ns, not significant; MHC, myosin heavy chain; TAC, transverse aortic constriction; w, weeks; WT, wild type.
