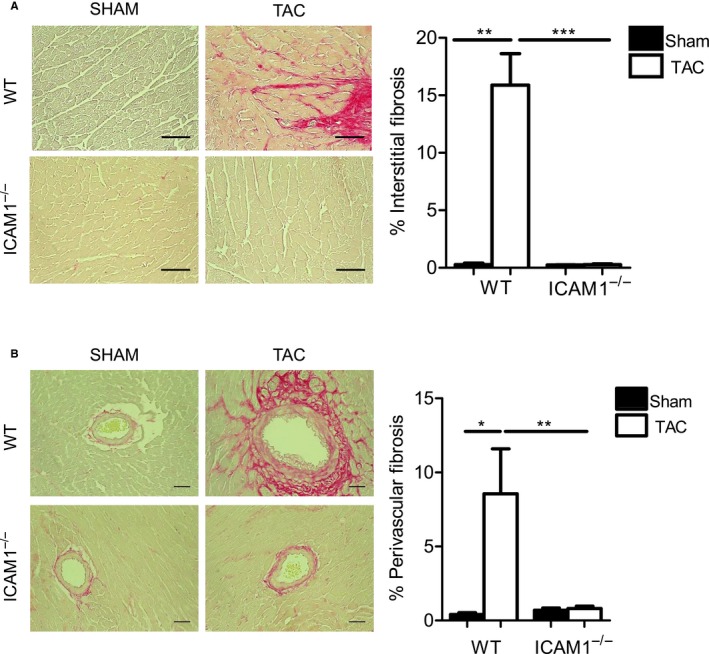
Figure 5.

Absence of fibrosis in ICAM1−/− in response to TAC. A, Representative photomicrographs (×40 magnification) and quantification (bar graph on the right) of myocardial interstitial fibrosis evaluated by picrosirius red staining of left ventricle sections from sham and TAC mice at 4 weeks. B, Representative pictograms (×20 magnification) shown on the left and percentage of perivascular fibrosis on the right. Scale bar=50 μm. n=3 to 5 sham, n=3 to 8 TAC. Statistical analysis used the unpaired t test. *P<0.05, **P<0.01, ***P<0.005. ICAM1 indicates intercellular cell adhesion molecule 1; TAC, transverse aortic constriction; WT, wild type.
