Figure 6.

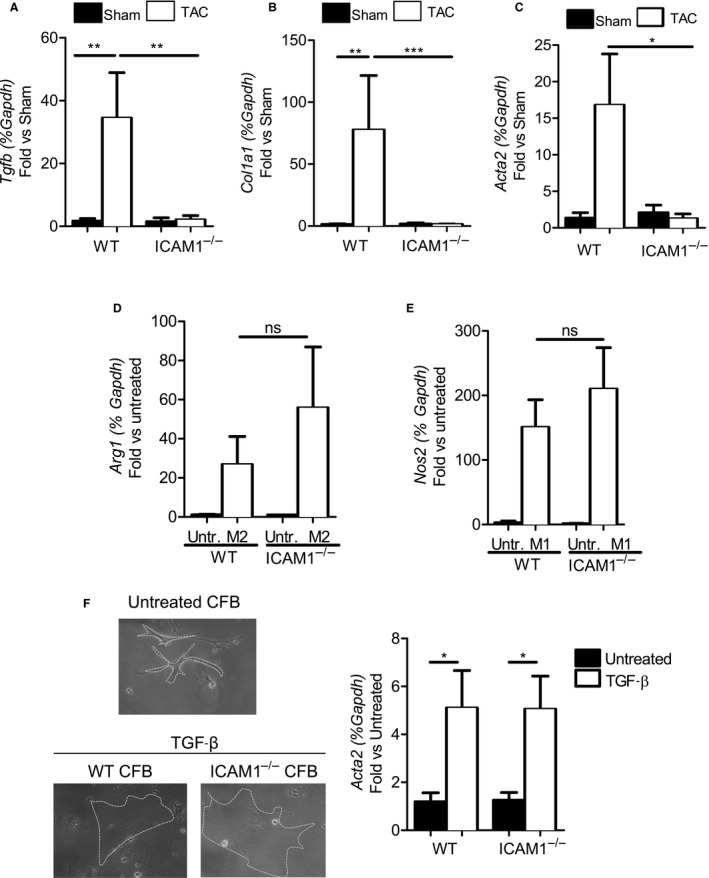
Absence of fibrosis mRNA marker upregulation in ICAM1−/− in response to TAC despite equal capacity for M2 profibrotic and myofibroblast differentiation in vitro. A through C, Quantitative reverse transcription polymerase chain reaction in the left ventricle for the fibrosis markers (A) TGF‐β, (B) collagen I, and (C) α‐SMA. mRNA expression normalized to sham. n=3 to 4 sham, n=6 to 9 TAC. Statistical analysis used the nonparametric Mann–Whitney test. Data shown as median (interquartile range): for TGF‐β: WT sham 1.594 (0.297–3.180) and WT TAC 7.209 (5.212–80.73), ICAM1−/− sham 0.2096 (0.186–3.964) and ICAM1−/− TAC 0.472 (0.263–1.768); for collagen I: WT sham 0.758 (0.615–2.431) and WT TAC 12.51 (3.596–109.6), ICAM1−/− sham 1.318 (0.321–3.388) and ICAM1−/− TAC 1.048 (0.840–1.610); for α‐SMA: WT sham 0.642 (0.552–2.824) and WT TAC 7.838 (0.441–37.80), ICAM1−/− sham 2.008 (0.240–3.953) and ICAM1−/− TAC 0.601 (0.233–1.704). D and E, WT and ICAM1−/− bone marrow–derived monocytes polarized to M2 and M1 macrophages in the presence of 20 ng/mL IL‐4 or 1 μg/mL LPS, respectively, for 3 days. Polarization was determined by mRNA expression of (D) arginase 1 for M2 and (E) inducible nitric oxide synthase for M1 macrophages. n=3 untreated, n=3 to 4 treated with IL‐4 or LPS. Statistical analysis used the unpaired t test. F, WT and ICAM1−/− cardiac fibroblast polarized to myofibroblast in the presence of 100 ng/mL TGF‐β for 16 hours. Polarization determined by mRNA expression of α‐SMA, Magnification ×20 representative pictures of each condition are shown on the left. n=4 to 6 untreated, n=6 to 7 TGF‐β treated. Statistical analysis used the unpaired t test.*P<0.05, **P<0.01, ***P<0.005. α‐SMA, α‐smooth muscle actin; ICAM1 indicates intercellular cell adhesion molecule 1; IL, interleukin; TAC, transverse aortic constriction; TGF‐β, transforming growth factor β; Untr., untreated; WT, wild type.
