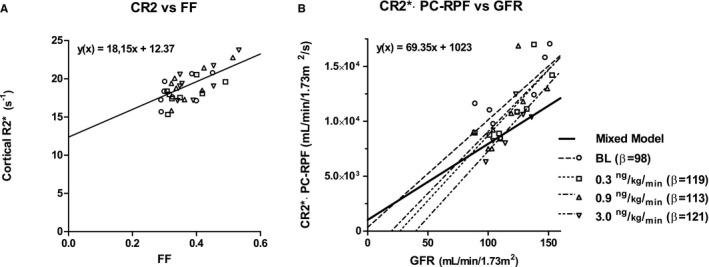
Figure 4.

BOLD MRI and kidney function correlations. A, Correlation between cortical R2* and filtration fraction, with fitted mixed model regression line (black) (F[7.69, 53.8]=18.15, P=0.049). B, Correlation between the product of PC‐RPF and cortical R2* vs GFR, with fitted regression lines for mixed model analysis (black line, F[15.9, 111]=69.3, P=0.02) and for each separate Ang‐II dose (dotted lines). Shapes of data points correspond to Ang‐II doses. Ang‐II indicates angiotensin II; BOLD, blood oxygen level dependent; MRI, magnetic resonance imaging; PC‐RPF, phase contrast MRI‐based renal plasma flow.
