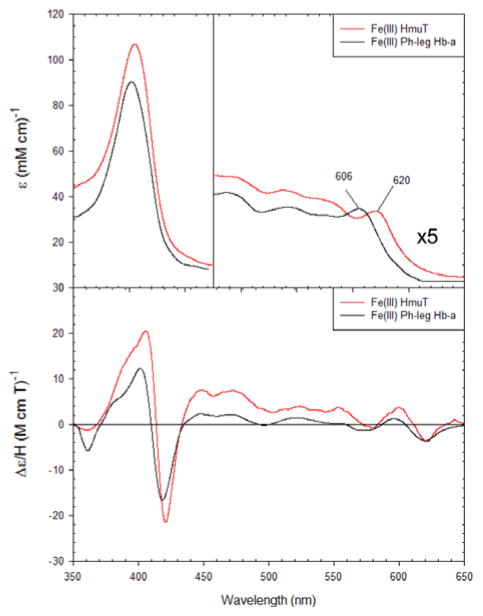
Figure 3.
The UV-visible and MCD comparison spectra for Fe(III) WT CdHmuT at pH 6.5 with Fe(III) phenol-bound leghemoglobin a. The samples were taken in 50 mM phosphate buffer. Spectra were slightly dependent on buffer conditions. The spectrum of phenol-bound leghemoglobin a was replotted from (76).

