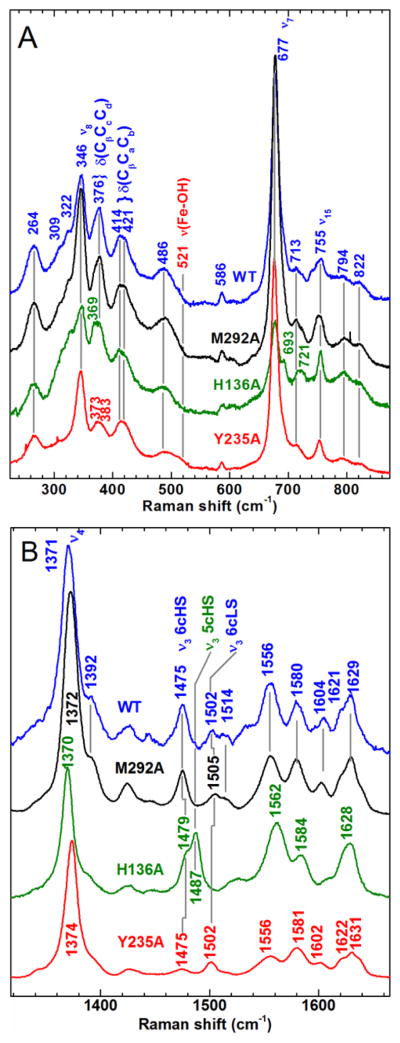
Figure 4.
Comparison of the Soret-excited rR spectra of WT CdHmuT, M292A, H136A, and Y235A. Protein concentrations were 80, 70, 25 and 36 μM, respectively. All samples were prepared in 50 mM Tris-Cl at pH 7.0. The spectra were recorded with 406.7-nm excitation. A) Low frequency and B) high frequency spectra of WT CdHmuT (blue), M292A (black), H136A (green), and Y235A (red).

