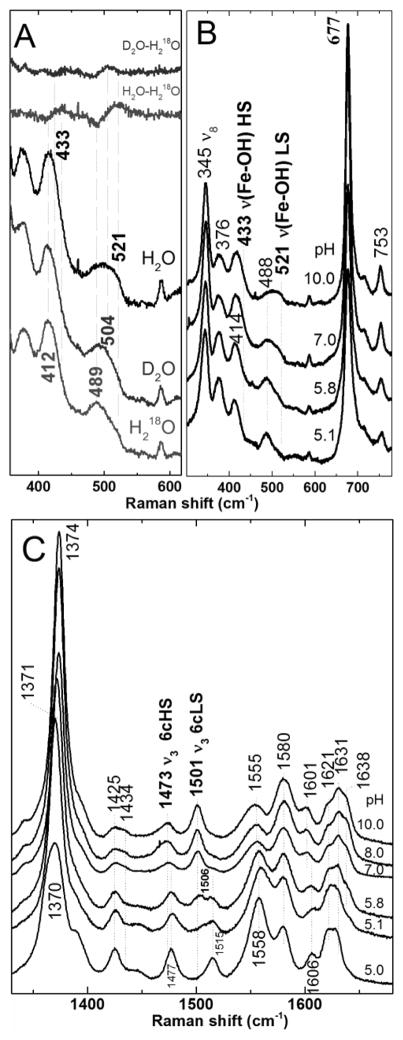
Figure 6.
The pH dependence of ferric Y235A monitored by 406.7 nm-excited rR spectra (11 mW power at sample). A) Isotopologs of Y235A at pH 10 prepared in H2O, D2O, and H218O. Difference spectra of D2O-H218O and H2O-H218O shown at the top of the figure were generated by subtraction of the respective parent spectra at the bottom of the figure. B) Low frequency and C) high frequency spectra of ferric Y235A as a function of pH. Samples were between 25 and 60 μM.

