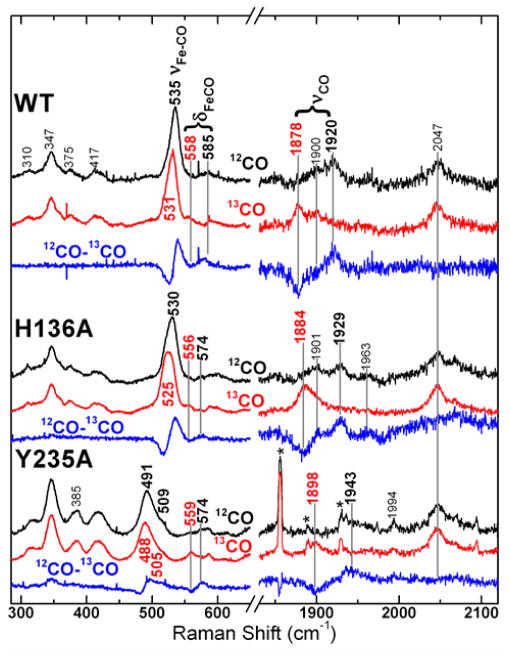
Figure 7.
Resonance Raman spectra of the ferrous carbonyls of WT CdHmuT, H136A, and Y235A recorded using 413.1-nm excitation. Natural abundance HmuT–CO (black), HmuT–13CO (red) and difference (blue) spectra are shown for each protein. Spectra of WT and H136A were recorded at pH 8.8 and that of Y235A at pH 8.2. The asterisks in the carbonyl stretching region of the Y235A spectrum mark plasma emission lines from the Kr+ laser.

