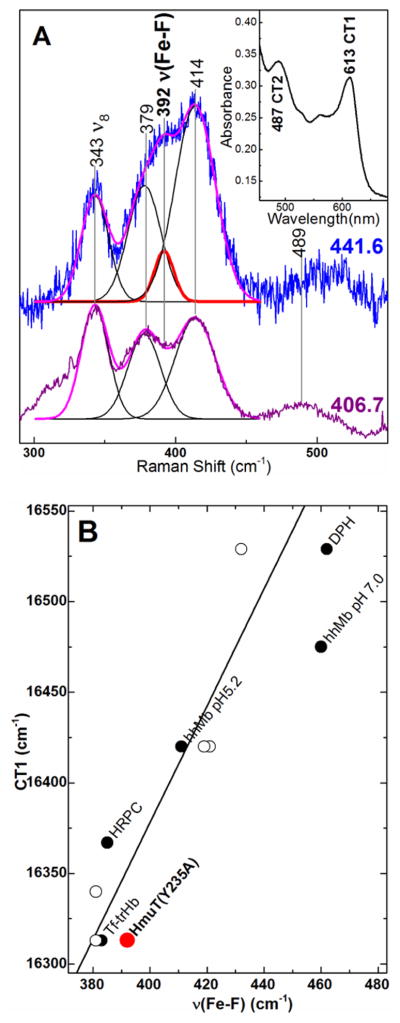
Figure 9.
Characterization of Y235A–F by correlation of the FeIII–F stretching frequency and CT1 energy. A) Low frequency window of the rR spectra of Y235A–F using Raman excitation into the CT2 (441.6 nm) and Soret (406.7 nm) bands. Protein was 80 μM in 100 mM sodium phosphate buffer in 330 mM sodium fluoride, pH 5.8. Laser power at the sample was 4.6 mW with 441.6-nm excitation and 9.7 mW with 406.7-nm excitation. Peak fitting analyses of both spectra are overlaid on the original spectra with the calculated FeIII–F stretching band shown in red; calculated ν8 and propionate and vinyl bending bands are shown in black; the overall fit is shown in magenta. Inset: Visible spectrum of Y235A–F rR sample. B) Correlation plot of νFe-F frequency and the CT1 energy. Y235A is shown in red. Other points are from Nicoletti and coworkers (98). Open circles are for mutants of truncated Hb from Thermobifida fusca (Tf-trHb) with varying number of hydrogen bonds between the distal pocket and the fluoride (97;98).

