Abstract
Poorly water soluble drugs comprise the majority of new drug molecules. Nanoparticle agglomerates, called NanoClusters, can increase the dissolution rate of poorly soluble compounds by increasing particle surface area. Budesonide and danazol, two poorly soluble steroids, were studied as model compounds. NanoCluster suspensions were made using a Netzsch MiniCer media mill with samples collected between 5 and 15 hours and lyophilized. DSC and PXRD were used to evaluate the physicochemical properties of the powders and BET was used to determine surface area. SEM confirmed NanoClusters were between 1 and 5 μm. NanoCluster samples showed an increase in dissolution rate compared to the micronized stock and similar to a dried nanoparticle suspension. BET analysis determined an increase in surface area of 8 times for budesonide NanoClusters and 10 to 15 times for danazol NanoClusters compared to micronized stock. Melting temperatures decreased with increased mill time of NanoClusters by DSC. The increased surface area of NanoClusters provides a potential micron-sized alternative to nanoparticles to increase dissolution rate of poorly water soluble drugs.
Keywords: NanoClusters, dissolution, drug delivery, budesonide, danazol, powder technology
1. Introduction
In a quest to identify highly potent and selective drugs, active pharmaceutical ingredients that have less desirable pharmaceutical properties are being developed1,2,3,4,5. Many of the compounds are BCS class II (high permeability but low solubility) or IV (both low permeability and solubility). BCS class II compounds can be particularly difficult to formulate6. In some instances, poor solubility and/or slow dissolution leads to low oral bioavailability, which can reduce their efficacy1,3,7,9. Oral administration is the most desirable route of administration given its high patient compliance and safety margins2,10. The fact that up to 70% of newly developed oral drugs along with 40% of drugs currently marketed are poorly water soluble presents a formidable challenge1,2,11.
Since many active pharmaceutical agents dissolve slowly in water, there have been new strategies developed to increase dissolution rate4,5. Formulation strategies varying excipients or other compounds can be used to enhance dissolution. Dissolution rate can be improved by increasing tablet disintegration or improving drug particle wetting7,9,12. Some strategies use polymer systems that dissolve with time to create a porous network of channels throughout the dosage form to increase the amount of water available to contact the poorly water soluble drug surface13,14. Other methods use excipients to create emulsions,11,15,16,17, combine liquids with powder forming liquisolid samples18,19, or to add wetting agents to improve disintegration of the solid dosage form7,9,12,20.
Besides different formulation strategies, there has also been a surge in technologies to increase dissolution by manipulating the size of drug particles20. There are bottom-up methods including precipitation, solid dispersions5,7,21, spray drying and spray freezing into liquid4,5,16,22,23,25 as well as top-down methods such as homogenization and milling3,16,25,26. Some bottom-up methods including precipitation can involve cosolvents18, which add the burden of solvent removal and disposal after processing and before use by patients27. Spray drying allows more precise control of particle size but may be an issue if the product is thermally labile4. Bottom-up methods including some precipitation methods and spray freezing into liquids can produce amorphous compounds. Amorphous compounds tend to be more intrinsically unstable than crystalline forms and can spontaneously revert to a lower energy crystalline form. Of course, changes in drug morphology over time are not desirable and may alter the properties of the drug22. Finally, bottom-up methods are typically more difficult to scale up to the large amounts needed in the pharmaceutical industry, which may be less desirable26.
Top-down approaches include methods such as milling25 and homogenization26. Milling can be further broken down into both dry and wet milling28. Dry milling includes jet milling, which has the tendency to create more surface defects, potentially increasing the associated electrostatics29. Wet milling can reduce surface defects by allowing some recrystallization to occur30. One such top down technology is called NanoCrystal®, where the drug compound is milled with surfactants to create and maintain individual nanoparticles in an effort to achieve more rapid dissolution11,31,32. The strategy behind many of these techniques is to decrease particle size to increase surface area,16,24. One potential issue with using surfactants is that surfactants can have side effects in patients24.
Overall many of these methods intend to decrease particle size1,18,33, but often the corollary of increased surface area is presupposed and not quantified33. This paper will analyze two poorly water soluble steroids, budesonide34 and danazol35 as model compounds to test increased dissolution by forming nanoparticle agglomerates, called NanoClusters through wet milling. Since they are agglomerates, NanoClusters36,37,38 offer both micronized particle and nanoparticle properties. NanoClusters could, therefore, provide an excipient free alternative to strategies such as NanoCrystal® technology31,32. Here, we investigate if increased surface area of NanoClusters improves dissolution of poorly water soluble compounds.
2. Materials and methods
2.1. Materials
Budesonide micronized stock (Bud) was obtained from Sicor de Mexico, Lerma, Mexico. Danazol micronized stock (Dan) was purchased from Voigt Global Distribution Inc, Lawrence, Kansas. Pluronic® F-68 was obtained from BASF, Florham, New Jersey. All water used was deionized (DI) water from a Labconco Pro PS system. All other chemicals and materials including acetonitrile, sodium lauryl sulfate, 0.1 μm pore size Whatman nylon filters, and Beckton Dickinson 3 mL plastic syringes, were purchased from Fisher Scientific.
2.2. NanoCluster synthesis by wet milling
Budesonide and danazol NanoCluster suspensions were synthesized using a Netzsch MiniCer Media Mill (NETZSCH Fine Particle Technology, LLC, Exton, PA). The mill was run with several predetermined process parameters including a grinder speed of 2772 rpm, a chiller unit temperature between 6 and 8°C, a mill temperature of 18°C, and a mill pressure of under 2 bar. The drug suspensions were milled using 200 μm YTZ® (yttrium treated zirconium) grinding media from Tosoh Corp., Tokyo, Japan.
Budesonide and danazol micronized stock were each suspended in nitrogen purged DI water to reduce the likelihood of oxidation during milling. Either drug (3.25 g) was added to 390 mL of nitrogen-flushed DI water. The powder was wetted by introducing drug slowly, while continuously stirring, and NanoClusters were produced by grinding with no added excipients. Both budesonide and danazol samples were collected at 5, 10, and 15 hours. Thirty mL of the suspension was collected at each time point with 10 mL deposited into three 20 mL antistatic vials. Upon completion, the remaining suspension was collected into 20 to 25 antistatic vials. Nanoparticle suspension samples were produced by milling in 0.1% (w/v) Pluronic® F-68 solution33,42 until a mean diameter of 150 to 200 nm was achieved. Samples were immediately frozen in liquid nitrogen and maintained at a temperature of −80 °C. Samples were lyophilized for 72 hours at a temperature of −72 °C at a vacuum of <300 millitorr (VirTis Feezemobile-12XL, The Virtis Company, NY).
2.3. NanoCluster particle size and morphology
A LEO 1550 field emission scanning electron microscope (SEM) was used to evaluate the particle size and morphology of the NanoCluster powder compared to the micronized stock and to the nanoparticle suspension39. Samples were sputter-coated with gold for 3 min. Dynamic light scattering (DLS) (Brookhaven Instruments Corp., ZetaPALS, Holtsville, NY) was performed to determine individual particle size comprising the agglomerates39. To better estimate the size of the nanoparticles and not the agglomerates, 0.5 mL of the milled suspension was diluted to 10 mL with 0.1% (w/v) Pluronic® F-68 solution. The suspension was then sonicated for 30 s at an amplitude of 20% with a microtip probe sonicator (Fisher Scientific, Sonic Dismembrator, Pittsburgh, PA) prior to analysis. The agglomerated NanoClusters were sized using micro flow imaging (MFI) (DPA 4100/4200 from Brightwell Technologies, Inc. Ottawa Canada) with Flow Microscope MVSS version 2 software. Samples were suspended in 0.01% sodium lauryl sulfate to ensure particles did not stick in the flow cell while maintaining a particle concentration of approximately 900000 counts/mL.
2.4. Surface area determination using BET
Surface area was determined via the BET (Brunauer, Emmett and Teller) Theory using a TriStar 3000, Micrometrics Gemini 2375 V 5.01, Norcross, GA connected to a computer running Star Driver (version 2.03). The surface area for the NanoClusters was measured for all powders by nitrogen adsorption and compared to that of the micronized stock drug and nanoparticle suspension. Prior to surface area measurement, a known mass of the sample powder (120 ± 30 mg) was placed in a sample tube. Another reference tube filled with 3 mm spherical glass beads was used as a reference. Liquid nitrogen was used to maintain the sample and reference tube at low temperature to yield an accurate determination of surface area17.
2.5. Determination of degradation using HPLC-UV
The chemical stability of the NanoCluster powder was determined by chromatographic analysis. The HPLC-UV system consisted of a Shimadzu CBM-20A system controller, LC-10AT solvent delivery pump, SPD-10A UV detector, and SIL-10AxL autoinjector. Chromatograms were acquired and analyzed using Shimadzu Class vp 7.4 software. A Kromasil C8 column (100 x 4.6 mm) was used for budesonide separation, while a Hypersil C18 (100 x 4.6 mm) was used for danazol. The powders used an isocratic system with a mobile phase of 55/45 acetonitrile/water at a flow rate of 1.1 mL/min. Detection was performed at 244 nm for budesonide, and danazol was detected at 288 nm. Samples of NanoClusters and micronized stock powder were made at a concentration of 250 μg/mL in acetonitrile and 30 μL was injected. The spectra showed a characteristic budesonide peak with a retention time of 4.55 min and a degradant peak with a retention time of 2.72 min. Danazol had a retention time of 9.2 min and a degradation peak at 6.35 min. Percent degradation was determined using the peak area of the degradant relative to the total peak area37,38,39.
2.6. NanoCluster crystallinity determination using powder x-ray diffraction (PXRD)
PXRD was used to determine the relative crystallinity of the NanoClusters compared to the miconized stock material. PXRD was performed using a monochromated CuKα radiation (λ = 1.54178 Å) on a Bruker Proteum Diffraction System equipped with Helios multilayer optics, an APEX II CCD detector or a Platinum 135 CCD detector and a Bruker MicroStar microfocus rotating anode x-ray source operating at 45 kV and 60 mA. The powder sample was suspended in Paratone N oil then loaded on a nylon loop. The loop was then loaded on the goniometer where either 3 or 2, 180° 1 minute scans (based on the detector) were taken using the Bruker Apex2 V2010.3-0 software package. Scans were taken at 30°, 60° and 90° with the detector 50.0 mm away. The patterns were analyzed using the Bruker EVA powder diffraction software package version 13.039.
2.7. NanoCluster analysis using differential scanning calorimetry (DSC)
DSC was performed to determine any thermal transitions of the NanoClusters compared to the micronized drug. DSC was performed on a Q100 DSC (TA Instruments). Approximately 3 to 5 mg of each sample was loaded into an aluminum hermetic pan. DSC was performed from 40 °C to 300 °C using a ramp of 10 °C per min for both budesonide and danazol39.
2.8. Dissolution of NanoCluster dry powder
Dissolution was performed using a Distek 2100A dissolution tester with temperature control system. Dissolution medium was 900 mL of 0.25% sodium lauryl sulfate solution. Approximately 25 mg of powder was wetted then added to the dissolution vessels mimicking the USP Type II paddle method (37 °C ± 0.5 °C, paddle speed of 75 rpm, and paddle depth of 2.5 mm from the bottom of the vessels). Three mL samples were taken at 5, 10, 15, 20, 30, 45, and 60 minutes with dissolution medium added to replace the sample volume. Samples were immediately filtered using a 0.1 μm nylon filter to remove any undissolved drug particles and were then analyzed using HPLC-UV under the same conditions specified to determine chemical degradation29,40.
3. Results and discussion
3.1. Wet milling created nanoparticle agglomerates
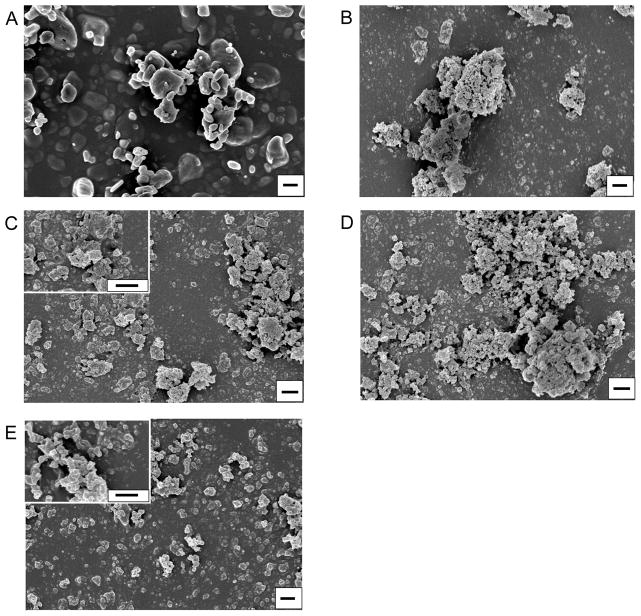
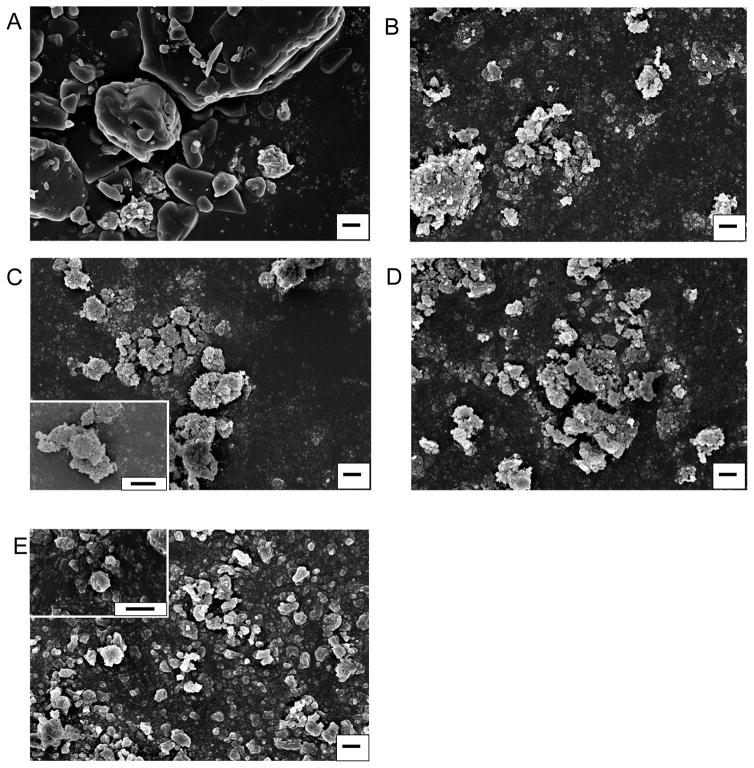
The wet milling process created nanoparticle agglomerates, called NanoClusters, which were confirmed using SEM39. There was a definitive decrease in particle size due to milling when compared to the stock micronized drug particles (Fig 1 and 2). The NanoClusters were in the size range of 1 to 4 μm and were composed of agglomerated drug nanoparticles approximately 200 nm in size. The micronized stock drugs were approximately 2 to 10 μm for both budesonide and danazol and were solid crystals. MFI confirmed that the typical median size or D50 of the NanoClusters was between 1 and 2 microns and decreased with milling time. The micronized stock was over 2 microns in size, slightly larger than both budesonide and danazol NanoClusters (Table 1 and 2). Samples were tested over a period of two years with a negligible change in particle size in both DLS and MFI (Table 1 and 2).
Fig. 1.
Scanning electron micrographs of budesonide NanoClusters at different milling times; A) micronized stock budesonide, B) 5 hour milled NanoCluster powder, C) 10 hour milled NanoCluster powder, D) 15 hour milled NanoCluster powder, E) nanoparticle suspension powder milled in 0.1% (w/v) Pluronic® F-68 solution. Magnification is 15000x with all scales bars being 1 μm and C and E insets including 50000x magnification.
Fig. 2.
Scanning electron micrographs of danazol NanoClusters at different milling times; A) micronized stock budesonide, B) 5 hour milled NanoCluster powder, C) 10 hour milled NanoCluster powder, D) 15 hour milled NanoCluster powder, E) nanoparticle suspension powder milled in 0.1% (w/v) Pluronic® F-68 solution. Magnification is 15000x with all scales bars being 1 μm and C and E insets including 50000x magnification.
Table 1.
Budesonide powder characteristics including percent degradation, particle sizing from DLS, D50 from MFI, BET surface area, and DSC melting temperature.
| Sample | Degradation | Particle Size | NanoCluster D50 Size | BET Surface Area | DSC Melting Temperature |
|---|---|---|---|---|---|
| Stock Budesonide | - | 1.7 um* | 2.2 um | 4.12±0.06 m2/g | 261.54 ºC |
| 5 Hour Milled | 0.20±0.02% | 352.5±2.2 nm | 1.5 um | 33.92±0.23 m2/g | 254.03 ºC |
| 10 Hour Milled | 0.51±0.05% | 373.0±5.1 nm | 1.1 um | 33.59±0.28 m2/g | 251.26 ºC |
| 15 Hour Milled | 0.88±0.08% | 420.7±11.5 nm | 1.0 um | 32.42±0.12 m2/g | 248.75 ºC |
| Nanoparticle Suspension | - | 236.3±2.6 nm | - | 35.55 m2/g** | 254.17 ºC |
Calculated from BET;
Calculated from particle size45
Particle size was determined using DLS while MFI was used to determine NanoCluster D50 size.
Table 2.
Danazol powder characteristics including percent degradation, particle sizing from DLS, D50 from MFI, BET surface area, and DSC melting temperature.
| Sample | Degradation | Particle Size | NanoCluster D50 Size | BET Surface Area | DSC Melting Temperature |
|---|---|---|---|---|---|
| Stock Danazol | - | 2.5 um* | 2.5 um | 3.28±0.03 m2/g | 227.49 ºC |
| 5 Hour Milled | 0.39±0.20% | 341.2±8.6 nm | 2.0 um | 25.86±0.10 m2/g | 223.82 ºC |
| 10 Hour Milled | 0.90±0.48% | 354.5±10.0 nm | 1.8 um | 36.75±0.14 m2/g | 222.08 ºC |
| 15 Hour Milled | 1.23±0.06% | 412.8±11.8 nm | 1.6 um | 47.65±0.26 m2/g | 220.89 ºC |
| Nanoparticle Suspension | - | 234.8±1.9 nm | - | 34.07 m2/g** | 224.78 ºC |
Calculated from BET;
Calculated from particle size45
Particle size was determined using DLS while MFI was used to determine NanoCluster D50 size.
The NanoClusters had a different particle morphology compared to the other samples (Fig 1B–D and 2B–D). The NanoClusters were somewhat spherical or irregular microparticles formed by agglomerated 200 – 400 nm nanoparticles with some cavities and voids left between the nanoparticles. The nanoparticle suspension samples were mostly individual nanoparticles stabilized by Pluronic® F-68 during synthesis (Fig 1E and 2E). Small agglomerates in the nanoparticle sample formed as a result of the drying process during lyophilization. The nanoparticle suspension samples had particle distribution mainly below 1 μm with a mean size of 250 nm with some reversible agglomeration occurring after lyophilization.
After an initial period of size reduction, the particles in the agglomerated NanoClusters slightly increased in size by approximately 70 nm with increasing milling time (Table 1 and 2). There are a couple of possible explanations for this increase in particle size. One would be that even though the agglomerates are sonicated in 0.1% (w/v) Pluronic® F-68 for sizing, the individual particles are still partially agglomerated together due to high surface energy. Individual particles are not being measured, just smaller agglomerates29. It is important to note that without the sonication step, the NanoClusters remained as agglomerated nanoparticles above the limits of DLS. Even in a dilute surfactant solution, the NanoClusters need to be subjected to intense ‘shear’ to disrupt the agglomerated microparticles to generate the individual nanoparticles. Another less likely explanation is the crystals of the drug are fractured to generate the decreased particle size, and over time crystal healing or Ostwald ripening occurs increasing the particle size29,20. This hypothesis was not supported, however, by SEM observations. SEM micrographs do give information about the morphology of the NanoClusters. The NanoClusters have voids between the nanoparticles (Fig 1 and 2), due to the agglomeration process which forms the particles. These voids are part of the reason for the increase in surface area facilitating an increased dissolution rate.
3.2. Increase in surface area and not a change in drug properties enhanced dissolution
The increased dissolution rate was a direct result of the increase in surface area of the NanoCluster samples. The micronized stock materials had surface areas around 3 to 4 m2/g, while the NanoCluster samples had surface areas of 8 times more for budesonide and even 10 to 15 times more for danazol (Table 1 and 2). There was no discernible trend for the increased surface area for budesonide as the milled NanoCluster samples all had approximately 33 m2/g (Table 1). Danazol, however, showed a considerable trend with longer mill times. There was an increase of approximately 11 m2/g for each 5 hour increase in mill time (Table 2) corresponding to an 8, 11, and 14 fold increase for the NanoCluster samples milled for 5, 10, and 15 hours, respectively.
The nanoparticle suspension for both compounds when run through BET surface area analysis gave a measured value of approximately 10 m2/g. This value does not agree with the surface area of 35 m2/g calculated from measured particle hydrodynamic radius suggesting that the Pluronic® stabilizer may have caused an anomalous reading. Comparing the calculated value with the milled NanoCluster samples shows that the surface area of the nanoparticle samples would match the respective budesonide NanoCluster samples and the 10 hour milled danazol NanoCluster sample. A calculation of nanoparticle suspension surface area (from dissolution data) is similar to the surface area of NanoClusters determined by BET (Table 1 and 2), which also supports the similar dissolution kinetics observed44.
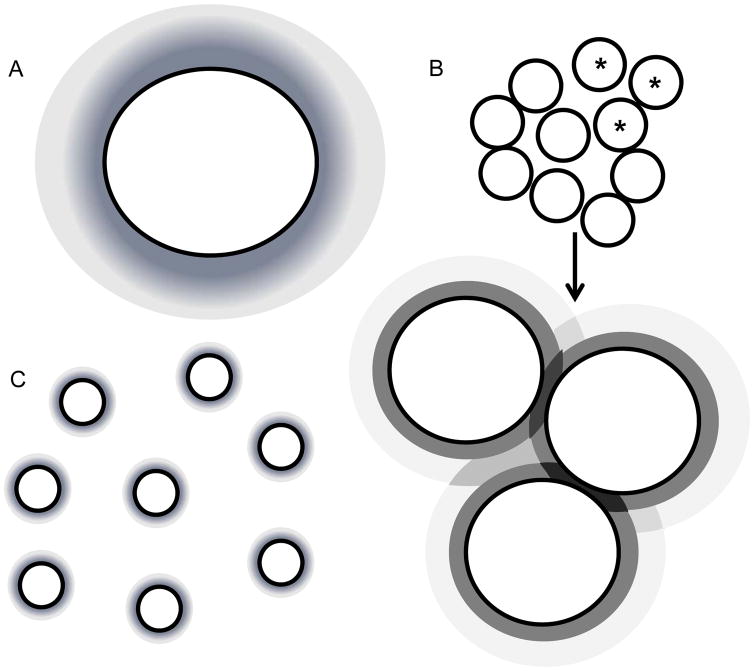
The increase in surface area would account for the increase in dissolution, but there were some observed differences in the trends. For budesonide, the surface area of all the milled NanoCluster samples and the nanoparticle suspension, were similar yet there were some small differences in the dissolution profiles. For danazol, there was a marketed difference in surface area between the milled NanoCluster samples, yet there was no discernible difference in the dissolution profiles. It is possible that attaining a ‘threshold’ surface area is important. In other words, increasing surface area by at least 7 times compared to the micronized stock diminishes differences for these particular drugs as the surface area is further increased. Another explanation could be local saturation. After a 7 to 8 fold increase in surface area, dissolution may not increase due to a lack of local sink conditions (i.e. within the NanoCluster) or some other factor specific to these two compounds. As mentioned before, concentration gradients from the surface of the individual nanoparticles may impinge (darker regions in Fig 8 as dissolution profiles overlap) yielding a more complicated dissolution profile than predicted by changes in surface area alone31. An enhancement would still be seen in dissolution, but that enhancement may not be as extensive as expected. Finally, it is also possible that these two compounds may not exhibit a strict surface area correlation39.
Fig. 8.
A shows the dissolution profiles surrounding the individual micronized stock particles. B shows a representation of the NanoClusters with an enlargement showing the 3 starred particles and how the dissolution profiles interact and may have a certain combinatorial effect. C shows the individual nanoparticles of the nanoparticle suspension and their individual dissolution profiles.
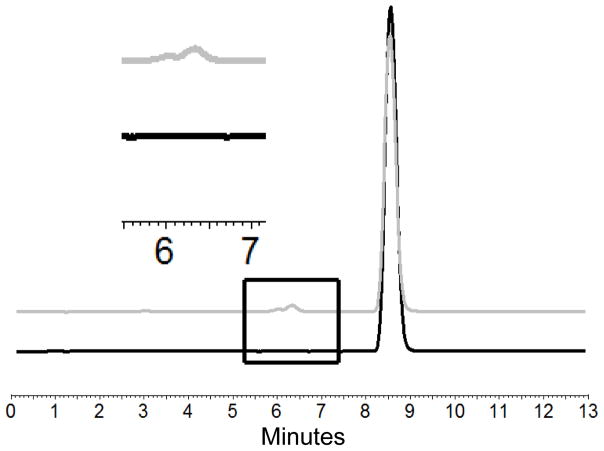
HPLC-UV analysis of NanoClusters showed that there was relatively little degradation even at extended milling times (Table 1 and 2)39. The percent degradation increased from 0.18% to 0.81% for budesonide and 0.21% to 1.29% for danazol as milling time progressed from 5 – 15 hours. The degradation products were determined by comparing the HPLC curves of the micronized stock and the milled products (Fig 9 and 10). Peaks were clearly separated allowing use of this approach. Previous literature results suggest the expected degradant products for budesonide to include 16α-hydroxyprednisolone and 6β-hydroxybudesonide34 and for danazol ethisterone and 2-hydroxymethyl ethisterone35. These compounds are formed as hydrophobic portions of the parent compound are removed thereby decreasing hydrophobicity. The removal of these hydrophobic regions increases the exposure of more polar heteroatoms. These two chemical differences explain why the new peaks associated with degradation products have eluted earlier in the reverse phase35,34.
Fig. 9.
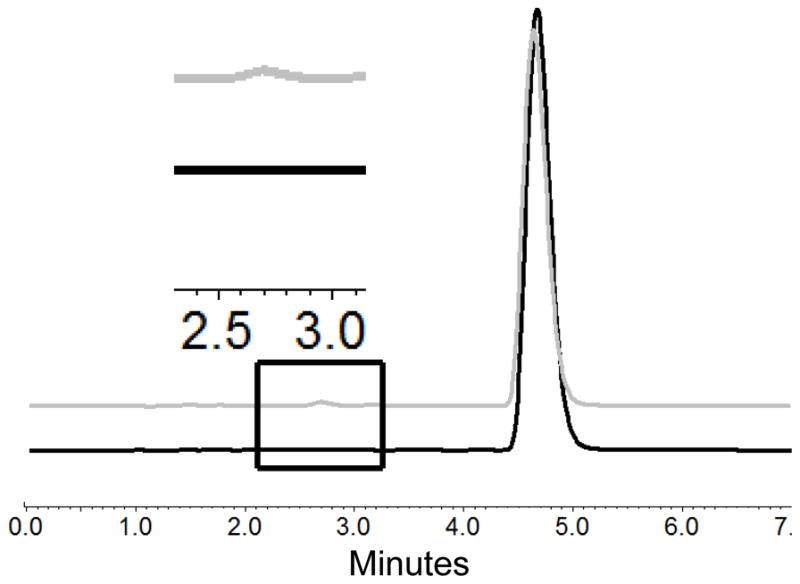
Chromatograms of budesonide micronized stock in black and 10 hour milled NanoClusters in gray showing the drug peak and degradation peak (retention time = 4.73 min and 2.72 min). The inset shows an enlarged view of the chromatograms illustrating the difference in the micronized stock with no degradant peak and milled NanoCluster samples with a degradant peak.
Fig. 10.
Chromatograms of danazol micronized stock in black and 10 hour milled NanoClusters in gray showing the drug peak and degradation peak (retention time = 8.62 min and 6.34 min). The inset shows an enlarged view of the chromatograms illustrating the difference in the micronized stock with no degradant peak and milled NanoCluster samples with a degradant peak.
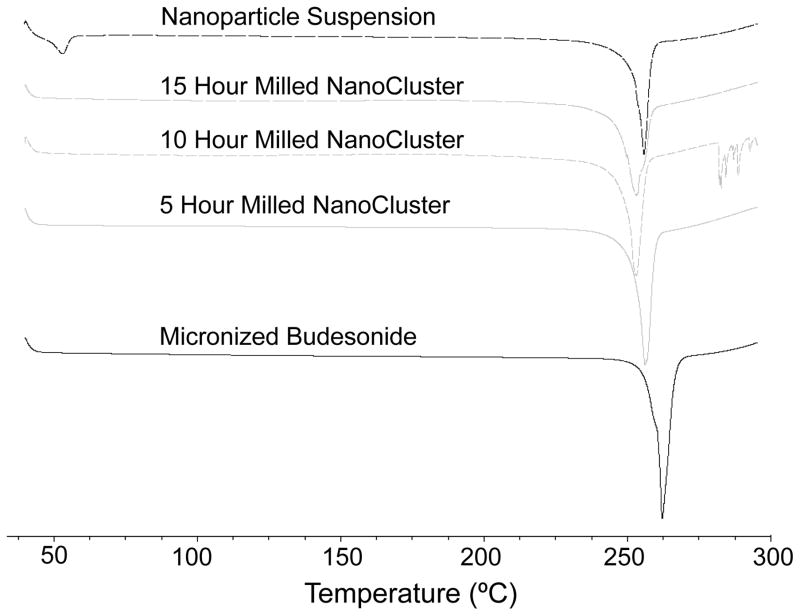
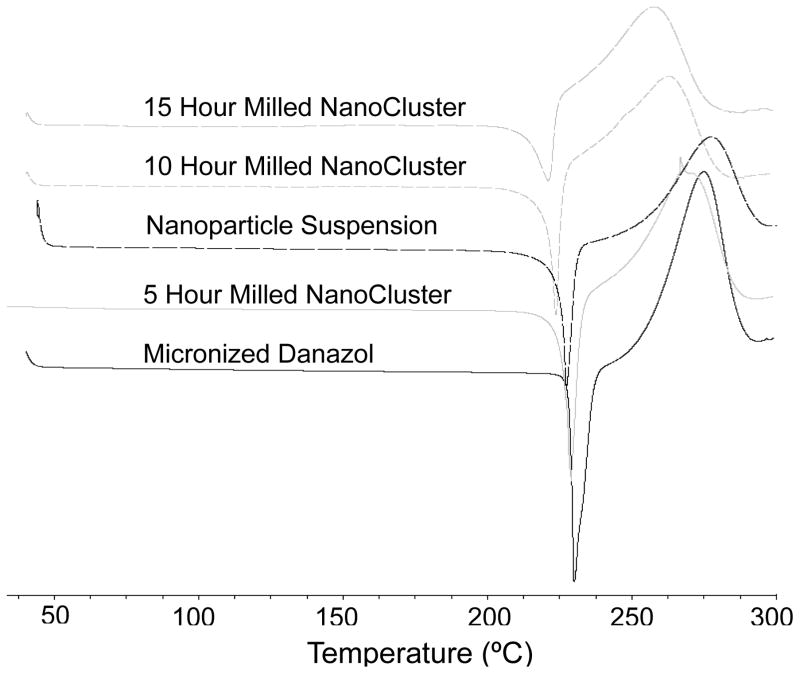
DSC thermograms illustrate the samples maintained the same relative crystallinity39. A decrease was seen in the melting temperature of both danazol and budesonide NanoCluster samples compared to the micronized stock material (Table 1 and 2). A decrease in melting temperature is commonly observed as particle size decreases. Since the NanoCluster samples are composed of nanoparticle agglomerates and each agglomerated microparticle has multiple crystals, heat is transported quickly in individual nanoparticles resulting in the decreased melting temperature as milling time increased. The nanoparticle powders also had decreased melting temperatures compared to the micronized stock material and had a similar melting temperature to the NanoCluster samples milled for 5 hours. The fact that the nanoparticle powder had a similar melting temperature to the NanoCluster samples and that the nanoparticle samples were milled for a short time is further evidence that the samples have not changed crystalline form to either an amorphous solid or different polymorph. The shape of the DSC curves provided further evidence as well. The curves have a very definitive and sharp peak expected for crystalline drugs (Fig 3 and 4).
Fig. 3.
DSC of budesonide powders. Black solid trace shows micronized budesonide stock, gray solid trace shows 5 hour milled NanoCluster powder, gray short dash trace shows 10 hour milled NanoCluster powder, gray long dash trace shows 15 hour milled NanoCluster powder, and black dash trace shows nanoparticle suspension powder milled in 0.1% (w/v) Pluronic® F-68 solution.
Fig. 4.
DSC of danazol powders. Black solid trace shows micronized danazol stock, gray solid trace shows 5 hour milled NanoCluster powder, black dash trace shows nanoparticle suspension powder milled in 0.1% (w/v) Pluronic® F-68 solution, gray short dash trace shows 10 hour milled NanoCluster powder, and gray long dash trace shows 15 hour milled NanoCluster powder.
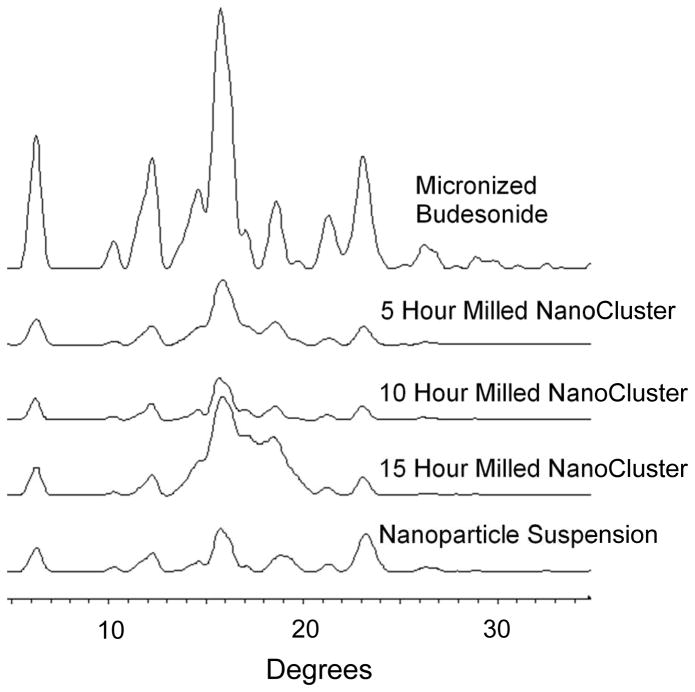
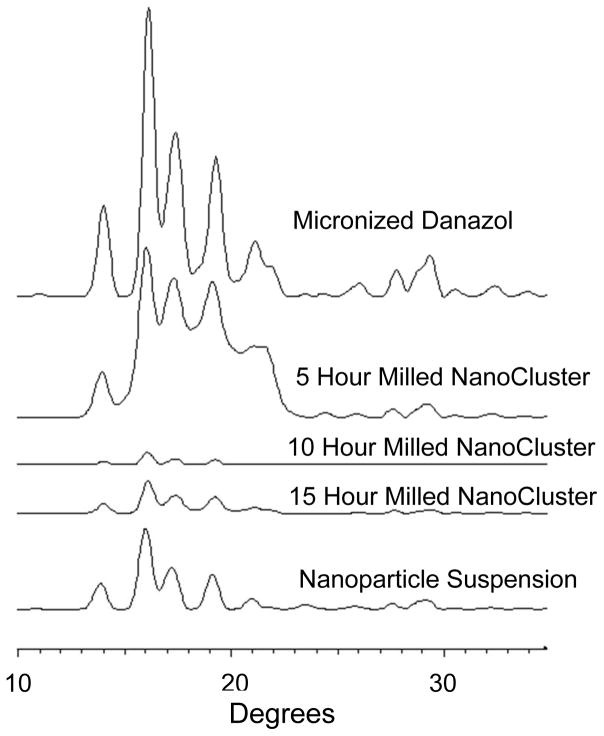
The PXRD data complements the DSC data and lends further credence to the idea that there was no change in crystallinity that caused the increase in dissolution rate (Fig 11 and 12)39. For budesonide, there was a decrease in peak intensity of the NanoCluster samples compared to the micronized stock budesonide. There was a small decrease in resolution from the micronized material as well compared to the NanoClusters, but the NanoClusters had a higher peak intensity compared to the nanoparticle sample. There was no trend in peak intensity that correlated to increases in mill time for the budesonide NanoClusters. The decrease in peak intensity seen particularly in Fig 12 can potentially be due to the nanosizing of the drug crystals. Nanosizing can produce differences in the xray scattering so the agglomerated particles can have subtle differences in scattering that may decrease intensity but peak position is more determinant. Differences due to nanosizing were also seen in the DSC thermograms, which provide further evidence that the decrease in signal intensity was not due to a change from crystalline to amorphous.
Fig. 11.
PXRD of budesonide powders where micronized budesonide is the top trace followed by 5 hour milled NanoCluster, 10 hour milled NanoCluster, 15 hour milled NanoCluster, and nanoparticle suspension in descending order.
Fig. 12.
PXRD of danazol powders micronized danazol is the top trace followed by 5 hour milled NanoCluster, 10 hour milled NanoCluster, 15 hour milled NanoCluster, and nanoparticle suspension in descending order.
The danazol samples had a slight difference from the budesonide samples. Similar to budesonide, the micronized danazol sample had a higher peak intensity and resolution as compared to the NanoClusters. The peak height in danazol NanoCluster samples did appear to decrease in intensity with increased mill time. The 5 hour milled NanoCluster sample had a higher intensity than the nanoparticle suspension sample but the 10 hour and 15 hour milled samples had a lower peak intensity on average.
There was an interesting repeating theme as the nanoparticle samples had very similar properties to the 5 hour milled NanoCluster samples or between the 5 and 10 hour milled NanoCluster samples. For example, even though the nanoparticle samples were milled for less than half the time of the 5 hour milled NanoCluster sample, all the samples had similar melting temperatures and PXRD patterns for both budesonide and danazol. Practically speaking, shorter mill times facilitate scaling to larger amounts.
3.3. NanoClusters enhanced dissolution rate
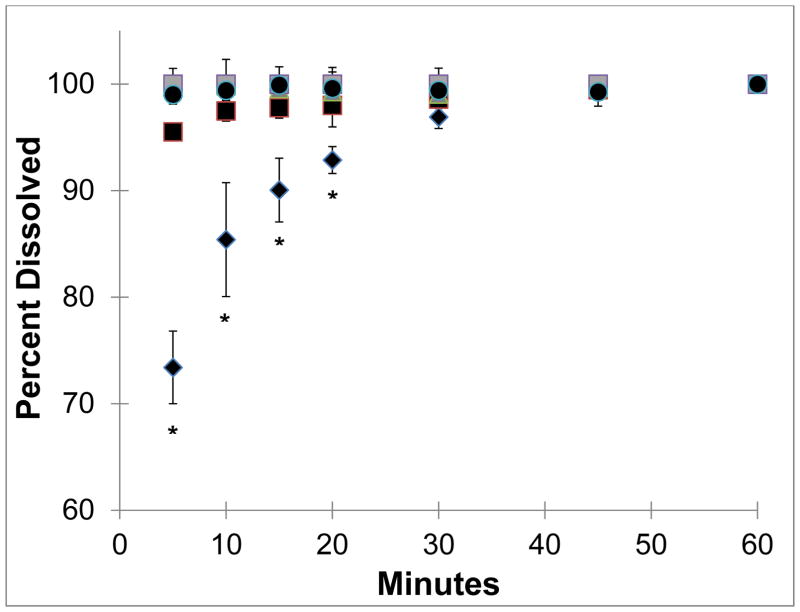
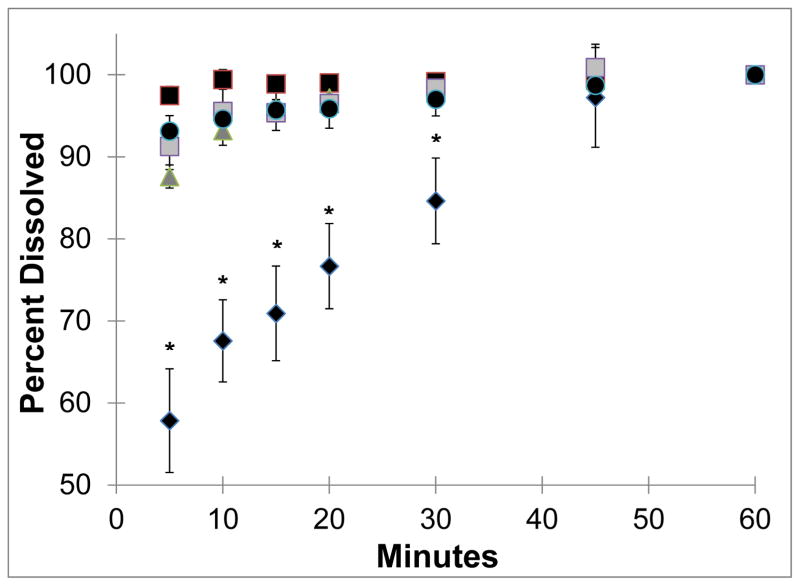
NanoCluster samples had increased dissolution rates as compared to the micronized stock drugs (Fig 5 and 6). Both budesonide and danazol micronized material gradually dissolved over the one hour study. Approximately 55% to 70% of the micronized drugs were dissolved in the first 5 minutes. Micronized budesonide and danazol samples required approximately 30 and 45 minutes, respectively, to dissolve completely. The nanoparticle suspension powder almost instantaneously dissolved and maintained a constant level over the course of the one hour study for both drugs. The NanoCluster samples had dissolution kinetics in between the two controls but were statistically more similar to the nanoparticle suspensions.
Fig. 5.
Dissolution of budesonide powders where diamonds show the micronized budesonide stock while the dark squares NanoCluster powder milled for 5 hours, triangles show NanoCluster powder milled for 10 hours, and light squares show the NanoCluster powder milled for 15 hours. The circles represent the nanoparticle suspension. All error bars are the standard deviations of 3 runs. Stars represent P values < 0.05 for micronized stock compared to NanoClusters and nanoparticle suspension.
Fig. 6.
Dissolution of danazol powders where diamonds show the micronized danazol stock while the dark squares NanoCluster powder milled for 5 hours, triangles show NanoCluster powder milled for 10 hours, and light squares show the NanoCluster powder milled for 15 hours. The circles represent the nanoparticle suspension. All error bars are the standard deviations of 3 runs. Stars represent P values < 0.05 for micronized stock compared to NanoClusters and nanoparticle suspension.
For budesonide, there appeared to be a minor correlation between NanoCluster milling time and dissolution rate. The NanoCluster sample milled for 5 hours appeared to have less drug dissolved in the first 15 minutes compared to the NanoCluster sample milled for 10 hours, which was lower than the NanoCluster sample milled for 15 hours by a similar margin. Differences in these dissolution rates, however, were not statistically significant according to a paired T-test. NanoCluster samples milled for 15 hours had a higher dissolution rate than 5 hour milled NanoClusters up to 30 minutes. For danazol, there did not appear to be any differences between the milled NanoCluster samples. There was a small gradual increase (about 10%) in concentration with the NanoCluster samples milled for 10 and 15 hours showing a similar trend to the increase seen in comparison to the micronized stock. These differences again were not significant. Overall, the NanoCluster samples had faster dissolution rates compared to the micronized stock and similar to the nanoparticle suspension, but differences between the different NanoCluster mill times were not significant.
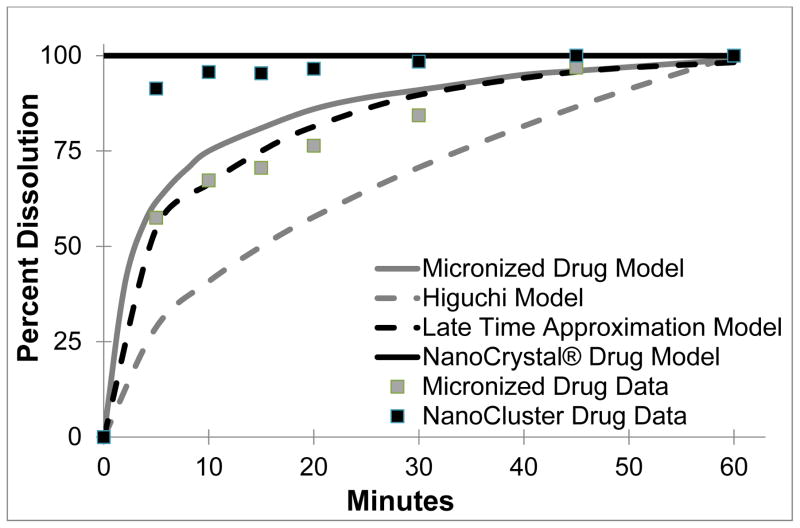
The next step was to model the dissolution profiles to see if they followed any previous models (Table 3 and Fig 7). The Higuchi model is the classical standard and follows a dissolution model as seen in Eqn 1, but it was originally developed to describe the transport from a thin film into the skin. The Higuchi model is a macroscopic model that does not apply to our microscopic system and does not have the same geometry as our system. Thus the predicted dissolution profile is far below the observed dissolution profiles (Fig 7)41.
Table 3.
Dissolution models along with the governing equations to model dissolution of micronized stock and NanoClusters. Includes description of variables and assumptions.
| Model | Main Dissolution Equation | Other Equations | Variables | Assumptions | |||||
|---|---|---|---|---|---|---|---|---|---|
| Classical Higuchi41 |
|
|
Ci = initial concentration Cs = drug solubility A = surface area D = diffusion coefficient t = time Mt = released drug |
|
|||||
| Higuchi – Peppas Derivation 42 |
|
(short time approximation) |
a = radius of sphere D = diffusion coefficient t = time n = diffusional exponent characteristic of release mechanism Mt = released drug |
|
|||||
| Siepmann 43 |
Monolithic solution
Monolithic Dispersion |
(late time approximation) |
Ci = initial concentration Cs = drug solubility a = radius of sphere D = diffusion coefficient R = radius of sphere t = time Mt = released drug |
|
Fig. 7.
Dissolution models are shown and how they best represent the dissolution of micronized stock and NanoClusters. Models included are the classical Higuchi in dotted gray and late time approximation based on the Peppas and Siepmann modified Higuchi model in dotted black as macroscopic models. Also included are microscopic models of micronized drug in solid gray and Nanocrystal® in solid black. Included in gray squares is the micronized stock data and in black squares is the NanoCluster data.
Further refinements of the Higuchi dissolution model were made by Peppas, who included multiple geometries including spheres and cylinders as drug release systems. Peppas solved for the dissolution from a sphere (Eqn 3). This equation was developed for tablets and formulations on a macroscopic scale, and when applied to the microparticles or nanoparticles used here, fails in part due to the smaller scale and irregular surface area of the NanoCluster system42. The last model used here was developed by Siepmann. This model was developed to describe release from several different drug carrier systems including drug reservoirs, monolithic solutions, or monolithic dispersions. The monolithic solution, which more closely resembles our NanoClusters samples as it is a sphere of homogenously dispersed drug with no exterior coating. The full model is the same as the system developed by Peppas (Eqn 3). The Siepmann model, however, provides a short time (less than 40% of drug released – Eqn 4) and a late time (more than 60% of drug released – Eqn 6) approximation for drug release. Again, using this model of late time approximation as the lowest amount of drug measured was 57% released, did not properly model NanoCluster dissolution kinetics. The major issue with this model, as with the previous two, is that this model targets macroscopic systems such as a tablet or capsule containing drug. As the system becomes smaller for micro and nanoparticles, the decreased radius skews the equations leading to inaccurate results43. In Fig 7, the Siepmann model is shown to have a good fit but that requires falsely inflating of the size of the particle, increasing it by 1000 fold to achieve this close fit.
Other models offer a better fit that can provide further explanation of this data. There are several models with NanoCrystal® technology which is similar to the nanoparticle suspension. A model based on two different processing methods: jet milled and NanoCrystal® was previously reported40. The reported jet milled product is very similar to the micronized stock used here with a median particle size of 3 μm and a distribution where 90% of the product is between 2 – 10 μm. The jet milled product has a similar size range as well to our milled NanoCluster providing a reasonable starting point to model dissolution of both the micronized stock and NanoClusters. The reported NanoCrystal® model has almost constant dissolution throughout time in the model. The difference in surface areas between the jet milled and NanoCrystal® was 8–9 fold. The jet milled model very closely traces our micronized stock profile with a slight overestimation but stays within 5% throughout the length of the study and model.
The more interesting observation occurs with the milled NanoClusters. Even though the NanoClusters have a similar geometric size to the jet milled product they have a similar dissolution profile to NanoCrystal® throughout most of the model. The NanoClusters have a similar increase in surface area compared to the micronized stock when contrasting the reported modeling of NanoCrystal® compared to the jet milled product. The only difference is in the early time frame which may be due to several factors.
One cause that could be simply not enough data points were collected during the early time phase (the first ten minutes). Another factor could be the NanoCluster microenvironment as illustrated in Fig 8. With the micronized stock and nanoparticle suspension, there may be well defined water contact with the free surface of drug particles allowing an approximation that sink conditions are maintained at all free surfaces. Because sink conditions can be maintained, the concentration profiles in gray are maintained allowing for simple modeling of dissolution from the particle surface (Fig 8A and 8C). Since NanoClusters are comprised of agglomerated nanoparticles, the space between the nanoparticles could experience a high local concentration that approaches or exceeds saturation. Due to the interplay of dissolution from adjacent surfaces, local concentration gradients could be affected. This complexity is difficult to model and may help explain the differences seen in the early time frame. As the particles continue to dissolve, the particles shrink providing a larger space between the individual particles thus reducing the impact of impinging concentration profiles allowing the model to capture the dissolution more accurately31.
4. Conclusion
As high as 40% of new pharmaceutical products are poorly water soluble, which in some cases can lower their oral bioavailability. One way to potentially increase the bioavailability of BCS class II compounds is to increase their dissolution rate. Wet milling either budesonide or danazol into nanoparticle agglomerates called NanoClusters yielded faster and more complete dissolution compared to micronized drug. NanoClusters had dissolution kinetics similar to nanoparticle suspension samples. The increased dissolution kinetics was theorized to be from an increase in surface area and not due to a change in crystalline form as demonstrated by DSC and PXRD analysis. By processing poorly water soluble drugs into NanoClusters, increased dissolution kinetics can be achieved using these high surface area micron-sized drug particles without the need for excipients.
Acknowledgments
Funding was provided by the University of Kansas Department Of Pharmaceutical Chemistry and the Dynamic Aspects of Chemical Biology Training Grant (T32 GM08545). We would like to thank Prof. C. Russell Middaugh (University of Kansas) for equipment use, the University of Kansas Microscopy Lab for SEM assistance, and NSF-MRI grant CHE-0923449 for purchasing part of the PXRD system.
References
- 1.Kawabata Yohei, Wada Koichi, Nakatani Manabu, Yamada Shizuo, Onoue Satomi. Formulation design for poorly water-soluble drugs based on biopharmaceutics classification system: Basic approaches and practical applications. International Journal of Pharmaceutics. 2011;420(1):1–10. doi: 10.1016/j.ijpharm.2011.08.032. [DOI] [PubMed] [Google Scholar]
- 2.Raseneck, Muller Dissolution Rate Enhancement by in Situ Micronization of Poorly Water Soluble Drugs. Pharmaceutical Research. 2002;19(12):1894–1900. doi: 10.1023/a:1021410028371. [DOI] [PubMed] [Google Scholar]
- 3.Liu Peng, Rong Xinyu, Laru Johanna, vanVeen Bert, Kiesvaara Juha, Hirvonen Jouni, Laaksonen Timo, Peltonen Leena. Nanosuspensions of poorly soluble drugs: Preparation and development by wet milling. International Journal of Pharmaceutics. 2011;411(1–2):215–222. doi: 10.1016/j.ijpharm.2011.03.050. [DOI] [PubMed] [Google Scholar]
- 4.Hu Jiahui, Rogers True L, Brown Judith, Young Tim, Johnston Keith P, Williams Robert O., III Improvement of Dissolution Rates of Poorly Water Soluble APIs Using Novel Spray Freezing into Liquid Technology. Pharmaceutical Research. 2002;19(9):1278–1284. doi: 10.1023/a:1020390422785. [DOI] [PubMed] [Google Scholar]
- 5.Hu Jiahui, Johnston Keith P, Williams Robert O., III Rapid dissolving high potency danazol powders produced by spray freezing into liquid process. International Journal of Pharmaceutics. 2004;271:145–154. doi: 10.1016/j.ijpharm.2003.11.003. [DOI] [PubMed] [Google Scholar]
- 6.Amidon GL, Lennernäs H, Shah VP, Crison JR. A theoretical basis for a biopharmaceutic drug classification: the correlation of in vitro drug product dissolution and in vivo bioavailability. Pharmaceutical Research. 1995;12(3):413–420. doi: 10.1023/a:1016212804288. [DOI] [PubMed] [Google Scholar]
- 7.Chen Xiaoxia, Vaughn Jason, Yacaman Miguel, Williams Robert, III, Johnston Keith. Rapid Dissolution of High-Potency Danazol Particles Produced by Evaporative Precipitation into Aqueous Solution. Journal of Pharmaceutical Sciences. 2004;93(7):1867–1878. doi: 10.1002/jps.20001. [DOI] [PubMed] [Google Scholar]
- 9.Vogt Markus, Kunath Klaus, Dressman Jennifer B. Dissolution improvement of four poorly water soluble drugs by cogrinding with commonly used excipients. International Journal of Pharmaceutics and Biopharmaceutics. 2008;68:330–338. doi: 10.1016/j.ejpb.2007.05.009. [DOI] [PubMed] [Google Scholar]
- 10.Mudie Deanna M, Amidon Gordon L, Amidon Gregory E. Physiological Parameters for Oral Delivery and in Vitro Testing. Molecular Pharmaceutics. 2010;7(5):1388–1405. doi: 10.1021/mp100149j. [DOI] [PMC free article] [PubMed] [Google Scholar]
- 11.Niwa Toshiyuki, Miura Satoru, Danjo Kazumi. Universal wet-milling technique to prepare oral nanosuspension focused on discovery and preclinical animal studies – Development of particle design method. International Journal of Pharmaceutics. 2011;405:218–227. doi: 10.1016/j.ijpharm.2010.12.013. [DOI] [PubMed] [Google Scholar]
- 12.Khan KA, Rhodes CT. Water-sorption Properties of Tablet Disintegrants. Journal of Pharmaceutical Sciences. 1975;64(3):447–451. doi: 10.1002/jps.2600640321. [DOI] [PubMed] [Google Scholar]
- 13.Edlund U, Albertsson A-C. Degradable Polymer Microspheres for Controlled Drug Delivery. Advances in Polymer Science. 2002;157:67–112. [Google Scholar]
- 14.Verma Rajan K, Garg Sanjay. Current Status of Drug Delivery Technologies and Future Directions. Pharmaceutical Technology On-Line. 2001;25(2):1–14. Dissolving excipients bring in water. [Google Scholar]
- 15.Maulvi Furqan A, Dalwadi Sonali J, Thakkar Vaishali T, Soni Tejal G, Gohel Mukesh C, Gandhi Tejal R. Improvement of dissolution rate of aceclofenac by solid dispersion technique. Powder Technology. 2011;207:47–54. [Google Scholar]
- 16.Sigfridsson Kalle, Björkman Jan-Arne, Skantze Pia, Zachrisson Helen. Usefulness of a Nanoparticle Formulation to Investigate Some Hemodynamic Parameters of a Poorly Soluble Compound. Journal of Pharmaceutical Sciences. 2011;100(6):2194–2202. doi: 10.1002/jps.22440. [DOI] [PubMed] [Google Scholar]
- 17.Li Chan, Li Caixia, Le Yuan, Chen Jian-Feng. Formation of bicalutamide nanodispersion for dissolution rate enhancement. International Journal of Pharmaceutics. 2011;404:257–263. doi: 10.1016/j.ijpharm.2010.11.015. [DOI] [PubMed] [Google Scholar]
- 18.Javadzadeh Yousef, Jafari-Navimipour Baharak, Nokhodchi Ali. Liquisolid technique for dissolution rate enhancement of a high dose water-insoluble drug (carbamazepine) International Journal of Pharmaceutics. 2007;341:26–34. doi: 10.1016/j.ijpharm.2007.03.034. [DOI] [PubMed] [Google Scholar]
- 19.Javadzadeha Yousef, Musaalrezaeia Leila, Nokhodchi Ali. Liquisolid technique as a new approach to sustain propranolol hydrochloride release from tablet matrices. International Journal of Pharmaceutics. 2008;362:102–108. doi: 10.1016/j.ijpharm.2008.06.022. [DOI] [PubMed] [Google Scholar]
- 20.Bailey Mark, Berkland Cory. Nanoparticle Formulations in Pulmonary Drug Delivery. Medicinal Research Reviews. 2008;29(1):196–212. doi: 10.1002/med.20140. [DOI] [PubMed] [Google Scholar]
- 21.Burapapadh Kanokporn, Takeuchi Hirofumi, Sriamornsak Pornsak. Novel pectin-based nanoparticles prepared from nanoemulsion templates for improving in vitro dissolution and in vivo absorption of poorly water-soluble drug. European Journal of Pharmaceutics and Biopharmaceutics. 2012 doi: 10.1016/j.ejpb.2012.07.010. http://dx.doi.org/10.1016/j.ejpb.2012.07.010. [DOI] [PubMed]
- 22.Rogers True, Johnston Keith P, Williams Robert O., III Physical Stability of Micronized Powders Produced by Spray-Freezing into Liquid (SFL) to Enhance the Dissolution of an Insoluble Drug. Pharmaceutical Development and Technology. 2003;8(2):187–197. doi: 10.1081/pdt-120018489. [DOI] [PubMed] [Google Scholar]
- 23.Rogers True L, Nelsen Andrew C, Sarkari Marazban, Young Timothy J, Johnston Keith P, Williams Robert O., III Enhanced Aqueous Dissolution of a Poorly Water Soluble Drug by Novel Particle Engineering Technology: Spray-Freezing into Liquid with Atmospheric Freeze-Drying. Pharmaceutical Research. 2003;20(3):485–493. doi: 10.1023/a:1022628826404. [DOI] [PubMed] [Google Scholar]
- 24.Pilcer Gabrielle, Amighi Karim. Formulation strategy and use of excipients in pulmonary drug delivery. International Journal of Pharmaceutics. 2010;392:1–19. doi: 10.1016/j.ijpharm.2010.03.017. [DOI] [PubMed] [Google Scholar]
- 25.Baba Koichi, Nishida Kohji. Calpain inhibitor nanocrystals prepared using Nano Spray Dryer B-90. Nanoscale Research Letters. 2012;7(436) doi: 10.1186/1556-276X-7-436. [DOI] [PMC free article] [PubMed] [Google Scholar]
- 26.Möschwitzer Jan. Nanotechnology:Particle Size Reduction Technologies in the Pharmaceutical Development Process. Particle Sizing. 2010 Apr;:54–59. [Google Scholar]
- 27.Carr Adam G, Mammucari Raffaella, Foster Neil R. Particle formation of budesonide from alcohol-modified subcritical water solutions. International Journal of Pharmaceutics. 2011;405:169–180. doi: 10.1016/j.ijpharm.2010.11.042. [DOI] [PubMed] [Google Scholar]
- 28.Jinno Jun-ichi, Kamada Naoki, Miyake Masateru, Yamada Keigo, Mukai Tadashi, Odomi Masaaki, Toguchi Hajime, Liversidge Gary G, Higaki Kazutaka, Kimura Toshikiro. In vitro–in vivo correlation for wet-milled tablet of poorly water-soluble cilostazol. Journal of Controlled Release. 2008;130:29–37. doi: 10.1016/j.jconrel.2008.05.013. [DOI] [PubMed] [Google Scholar]
- 29.Sugimoto Shohei, Niwa Toshiyuki, Nakanishi Yasuo, Danjo Kazumi. Novel Ultra-Cryo Milling and Co-grinding Technique in Liquid Nitrogen to Produce Dissolution-Enhanced Nanoparticles for Poorly Water-Soluble Drugs. Chemical and Pharmaceutical Bulletin. 2012;60(3):325–333. doi: 10.1248/cpb.60.325. [DOI] [PubMed] [Google Scholar]
- 30.Merisko-Liversidge Elaine, Liversidge Gary G. Nanosizing for oral and parenteral drug delivery: A perspective on formulating poorly-water soluble compounds using wet media milling technology. Advanced Drug Delivery Reviews. 2011;63(6):427–440. doi: 10.1016/j.addr.2010.12.007. [DOI] [PubMed] [Google Scholar]
- 31.Liversidge Gary G, Cundy Kenneth C. Particle size reduction for improvement of oral bioavailability of hydrophobic drugs: I. Absolute oral bioavailability of nanocrystalline danazol in beagle dogs. International Journal of Pharmaceutics. 1995;125:91–97. [Google Scholar]
- 32.Merisko-Liversidge Elaine, Liversidge Gary G. Drug Nanoparticles: Formulating Poorly Water-Soluble Compounds. Toxicologic Pathology. 2008;36:43–48. doi: 10.1177/0192623307310946. [DOI] [PubMed] [Google Scholar]
- 33.Tanaka Yusuke, Inkyo Mitsugi, Yumoto Ryoko, Nagai Junya, Takano Mikihisa, Nagata Shunji. Evaluation of In Vitro Dissolution and In Vivo Oral Absorption of Drug Nanopowders Prepared by Novel Wet-Milling Equipment. Current Nanoscience. 2010;6:571–576. [Google Scholar]
- 34.Szefler Stanley J. Pharmacodynamics and pharmacokinetics of budesonide: A new nebulized corticosteroid. Journal of Allergy and Clinical Immunology. 1999;104:S175–S183. doi: 10.1016/s0091-6749(99)70059-x. [DOI] [PubMed] [Google Scholar]
- 35.Potts GO, Schane HP, Edelson J. Pharmacology and Pharmackinetics of Danazol. Drugs. 1980;19(5):321–330. doi: 10.2165/00003495-198019050-00001. [DOI] [PubMed] [Google Scholar]
- 36.Aillon Kristin L, El-Gendy Nashwa, Dennis Connor, Norenberg Jeffrey P, McDonald Jacob, Berkland Cory. Iodinated NanoClusters as an Inhaled Computed Tomography Contrast Agent for Lung Visualization. Molecular Pharmaceutics. 2010;7(4):1274–1282. doi: 10.1021/mp1000718. [DOI] [PMC free article] [PubMed] [Google Scholar]
- 37.El-Gendy Nashwa, Huang Shan, Selvam Parthiban, Soni Pravin, Berkland Cory. Development of Budesonide NanoCluster Dry Powder Aerosols: Formulation and Stability. Journal of Pharmaceutical Sciences. 2012;101(9):3445–3455. doi: 10.1002/jps.23176. [DOI] [PubMed] [Google Scholar]
- 38.El-Gendy Nashwa, Huang Shan, Selvam Parthiban, Soni Pravin, Berkland Cory. Development of Budesonide NanoCluster Dry Powder Aerosols: Processing. Journal of Pharmaceutical Sciences. 2012;101(9):3425–3433. doi: 10.1002/jps.23168. [DOI] [PubMed] [Google Scholar]
- 39.Tanaka Yusuke, Inkyo Mitsugi, Yumoto Ryoko, Nagai Junya, Takano Mikihisa, Nagata Shunji. Nanoparticulation of poorly water soluble drugs using a wet-mill process and physiochemical properties of the Nanopowders. Chemical and pharmaceutical Bulletin. 2009;57(10):1050–1057. doi: 10.1248/cpb.57.1050. [DOI] [PubMed] [Google Scholar]
- 40.Jinno Jun-ichi, Kamada Naoki, Miyake Masateru, Yamada Keigo, Mukai Tadashi, Odomi Masaaki, Toguchi Hajime, Liversidge Gary G, Higaki Kazutaka, Kimura Toshikiro. Effect of particle size reduction on dissolution and oral absorption of a poorly water-soluble drug, cilostazol, in beagle dogs. Journal of Controlled Release. 2006;111:56–64. doi: 10.1016/j.jconrel.2005.11.013. [DOI] [PubMed] [Google Scholar]
- 41.Siepmann Juergen, Peppas Nicholas A. Higuchi equation: Derivation, applications, use and misuse. International Journal of Pharmaceutics. 2011;418(1):6–12. doi: 10.1016/j.ijpharm.2011.03.051. [DOI] [PubMed] [Google Scholar]
- 42.Ritger Philip, Peppas Nikolaos. A simple equation for description of solute release 1. Fickian and non-fickian release from non-swellable devices in the formof slabs, spheres, cylinders or discs. Journal of Controlled Release. 1987;5(1):23–36. [PubMed] [Google Scholar]
- 43.Siepmann Juergen, Siepmann Florence. Modeling of diffusion controlled drug delivery. Journal of Controlled Release. 2012;161(2):351–362. doi: 10.1016/j.jconrel.2011.10.006. [DOI] [PubMed] [Google Scholar]
- 44.Diedrich Tamara, Dybowska Agnieszka, Schott Jacques, Valsami-Jones Eugenia, Oelkers Eric H. The Dissolution Rates of SiO2 Nanoparticles As a Function of Particle Size. Environmental Science and Technology. 2012;46:4909–4915. doi: 10.1021/es2045053. [DOI] [PubMed] [Google Scholar]
- 45.Thiele G, Poston M, Brown R. A Case Study in Sizing Nanoparticles. Micromeritics Analytical Services. Sizing Nanoparticles Press Release. [Google Scholar]
- 46.El-Gendy Nashwa, Gorman Eric, Munson Eric, Berkland Cory. Budesonide Nanoparticle Agglomerates as Dry Powder Aerosols with Rapid Dissolution. Journal of Pharmaceutical Sciences. 2008;98(8) doi: 10.1002/jps.21630. [DOI] [PMC free article] [PubMed] [Google Scholar]
- 47.Léonard G, Abatzoglou N. Lubrication of pharmaceutical powder/wall interfaces and electrostatic effects. Powder Technology. 2011;208(1):54–62. [Google Scholar]


