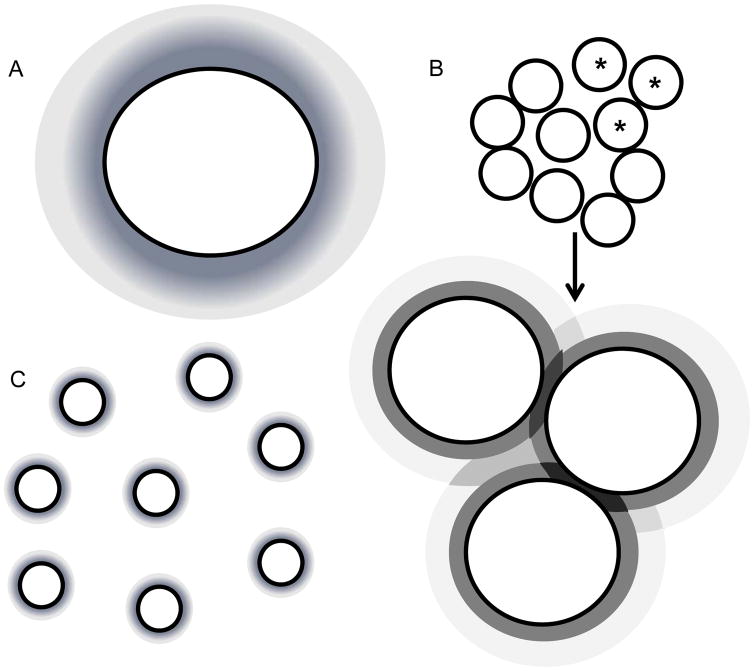
Fig. 8.
A shows the dissolution profiles surrounding the individual micronized stock particles. B shows a representation of the NanoClusters with an enlargement showing the 3 starred particles and how the dissolution profiles interact and may have a certain combinatorial effect. C shows the individual nanoparticles of the nanoparticle suspension and their individual dissolution profiles.

