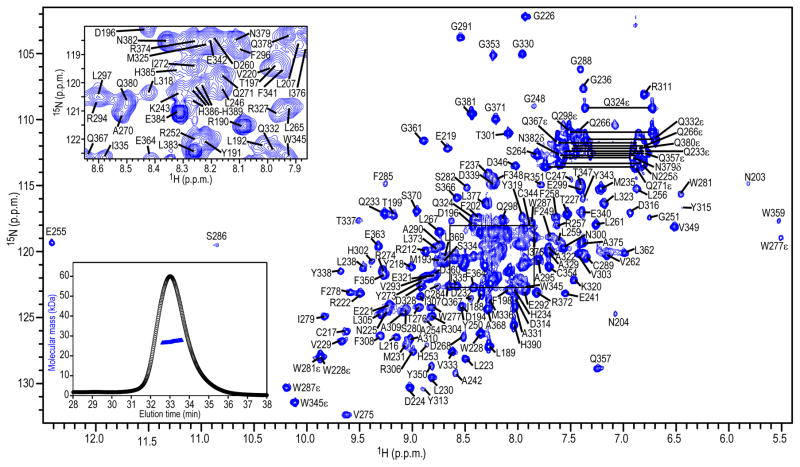
Figure 2.
800 MHz 1H-15N HSQC NMR spectrum of 76 μM 13C/15N-labeled A3B-CTD in 25 mM sodium phosphate, pH 6.9, 25° C. Assignments are indicated by residue name and number. An expansion of the boxed region is provided in the inset in the upper left corner. SEC-MALS data are shown in the inset in the lower left corner, with the elution profile indicated with black circles and the estimated molecular mass across the peak with blue triangles.

