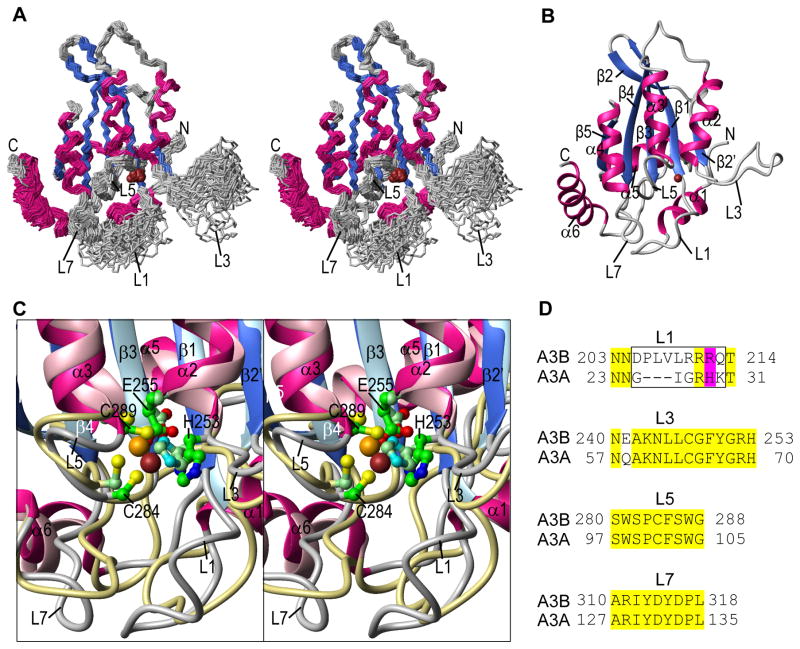
Figure 3.
A3B-CTD NMR solution structure. (A) Stereo-view (defocused) of the backbone (N, Cα, C′) atoms of the final 30-conformer ensemble. Regions of helical and beta sheet structures are colored magenta and blue, respectively, and the remainder of the structure is colored grey. The Zn2+ ion is shown as a brown ball. (B) Ribbon representation of the lowest energy structure of the ensemble, using the same color scheme as in (A). Secondary structure elements are labeled. (C) Stereo-view (defocused) of the superposition of the active site regions of the current A3B-CTD NMR and the A3A NMR (PDB: 2M6588) structures. Secondary structure elements of the A3B-CTD structure are colored using the same color scheme as in (A) and (B) and those of A3A are colored in pink (helices), light blue (beta strands), and khaki (loops). The active site residues (H253, E255, C284, and C289 in A3B-CTD and H70, E72, C101, and C106 in A3A) and the Zn2+ ions are shown in ball and stick representation with carbon, nitrogen, oxygen, sulfur, and zinc atoms in green, blue, red, yellow, and brown, respectively, for A3B-CTD, or in pale green, cyan, red, yellow, and orange, respectively, for A3A. The active site residues are labeled only in the A3B-CTD structure. (D) Amino acid sequence alignment of loops 1, 3, 5, and 7 for A3B-CTD and A3A. The entire sequence alignment is given in Supplementary Figure S4. Identical residues are highlighted in yellow; residues in the loop 1 region that were changed to construct the A3B-CTD L1 mutant are enclosed in a black rectangle. Residues R212 (A3B-CTD) and H29 (A3A) are highlighted in magenta.

