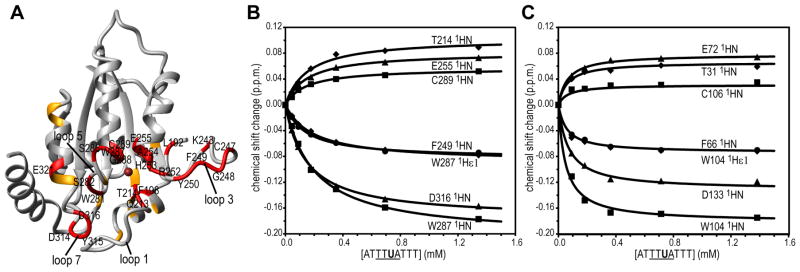
Figure 4.
Structural mapping of 5′-ATTTUATTT-3′ binding to A3B-CTD. (A) Residues whose resonances experience significant 1H,15N chemical shift changes upon binding are colored red (>0.050 p.p.m.) or orange (0.028–0.050 p.p.m.). 1H,15N-combined chemical shift changes were calculated using , with ΔδHN and ΔδN representing 1HN and 15N chemical shift differences, respectively. (B) and (C) Binding isotherms for representative 1HN resonances of A3B-CTD (B) and A3A (C).

