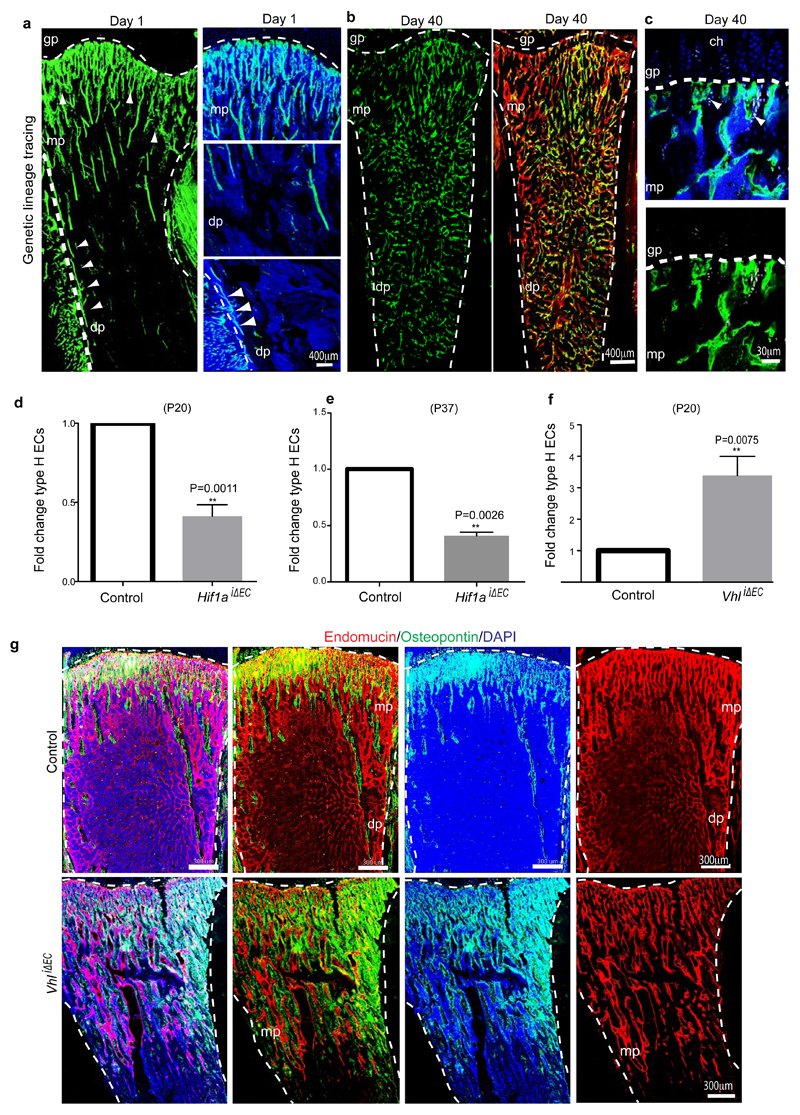
Extended Data Figure 7. Lineage tracing of type H endothelium and analysis of HIF pathway mutants.
a-b, Representative confocal images of sectioned tibiae from the genetic lineage tracing experiment analysed at 1 and 40 days after tamoxifen administration. GFP-labelled ECs (green) seen in Cdh5(PAC)-CreERT2 x Rosa26-mT/mG double transgenics after 1 day correspond arteries and type H endothelium (arrowheads) in the metaphysis (mp) and endosteum, but not in sinusoidal vessels of the diaphysis (dp). Counterstaining of ECs with anti-Endomucin antibody (red fluorescence) in samples taken after 40 days shows expansion of the GFP+ endothelium into the diaphyseal microvasculature. Nuclei in small insets in (a), DAPI (blue). Dashed lines indicate border of growth plate (gp) and outline of compact bone.
c, Representative confocal images of metaphyseal (mp) region in tibiae from the genetic lineage tracing experiment analysed at day 40 after tamoxifen administration showing GFP-labelled ECs (green) in Cdh5(PAC)-CreERT2 x Rosa26-mT/mG double transgenics and Osterix staining (white). Nuclei stained with DAPI (blue). Dashed lines drawn below chondrocytes (ch) lines indicate border of growth plate (gp).
d-e, Quantitative analysis of CD31hi/Emcnhi ECs in long bone from Hif1aiΔEC and corresponding littermate controls analysed at postnatal day 20 (P20, d) or P37 (e). Shown is fold change in frequency of ECs CD31hi/Emcnhi ECs identified by flow cytometry. Data represent mean±s.e.m (n=7 mice from three independent experiments d; n=6 mice from three independent experiments e). P values, two-tailed unpaired t-test.
f, Quantitative analysis of CD31hi/Emcnhi ECs in long bone from VhliΔEC and corresponding littermate controls analysed at postnatal day (P20). Shown is fold change in frequency of ECs CD31hi/Emcnhi ECs identified by flow cytometry. Data represent mean±s.e.m (n=5 mice from three independent experiments). P values, two-tailed unpaired t-test.
g, Representative tile scan confocal images from tibia sections of control and VhliΔEC mutants immunostained for Endomucin (red) and Osteopontin (green). Nuclei, DAPI (blue). Note widespread osteopontin staining in VhliΔEC mutant tibia. gp, growth plate; mp, metaphysis; dp, diaphysis; es, endosteum.

