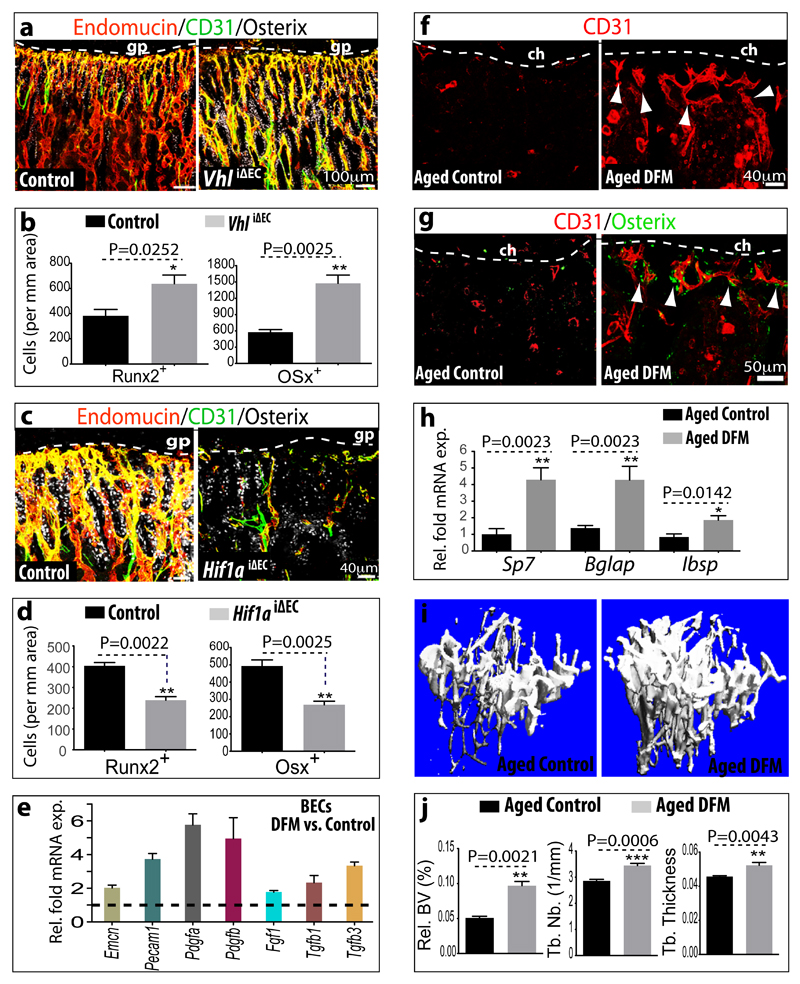
Figure 5.
Type H ECs couple angiogenesis and osteogenesis.
a, Confocal images of CD31 (green), Endomucin (red) and Osterix (white) immunostained, 3 week-old VhliΔEC and control tibiae.
b, Quantitation of Runx2+ and Osterix+ (Osx) cells in VhliΔEC mutants and controls. Data represent mean±s.e.m (n=5 mice in two independent experiments. P values, twotailed unpaired t-test.
c, Maximum intensity projections of 3 week-old Hif1aiΔEC and control tibia stained for CD31 (green), Endomucin (red) and Osterix (white). Growth plate, gp.
d, Quantitation of Runx2+ and Osterix+ cells in Hif1aiΔEC mutant and control long bone. Data represent mean±s.e.m (n=5 mice in three independent experiments). P values, two-tailed unpaired t-test.
e, qPCR mRNA analysis of DFM or vehicle-treated bone endothelial cells (BECs). Data represent mean±s.e.m (n=3 biological replicates). Note induction of growth factor expression by DFM.
f, g, Representative images of CD31 (red, f, g) and Osterix (green, g) stained tibia sections from aged DFM-treated and control mice. Low intensity projection shows only CD31hi cells. DFM induces CD31hi vessels and Osterix+ osteoprogenitors. Chondrocytes, ch.
h, qPCR analysis of Sp7 (encoding Osterix), Bglap (bone gamma-carboxyglutamate protein) and Ibsp (integrin-binding sialoprotein) mRNA expression relative to Actb in the aged DFM-treated or vehicle control femur. Data represent mean±s.e.m (n=6-8 mice in four independent experiments). P values, two-tailed unpaired t-test.
i, Representative μ-CT images of aged DFM-treated and control tibiae.
j, Quantitative μ-CT analysis of relative bone volume (Rel. BV), trabecular number (Tb. Nb), and trabecular thickness (Tb. Thickness) in proximal tibia. Data represent mean±s.e.m (n=5 mice in two independent experiments). P values, two-tailed unpaired t-test.

