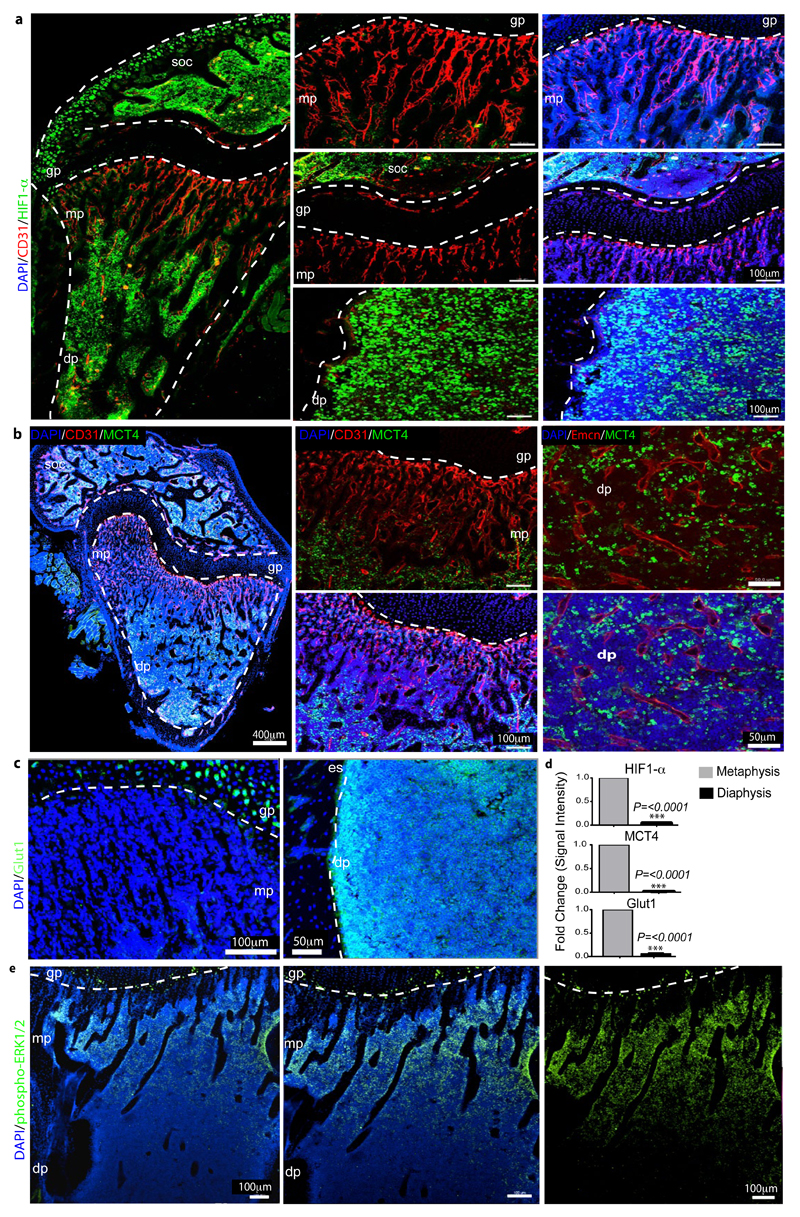
Extended Data Figure 3. Regional differences in metabolic marker expression.
a, Representative confocal images showing HIF1-α (green) and CD31 (red) immunostaining on sections of 7 week-old tibiae. Nuclei, DAPI (blue). Note abundance of HIF1α-positive nuclei in the diaphysis (dp) and secondary ossification centre (soc) but not in the metaphyseal (mp) region near the growth plate (gp). Dashed lines indicate borders of the growth plate (left and centre) or, in panels on the right, the endosteum (es).
b, Maximum intensity projections of tibial sections from 7 week-old mice showing immunostaining for the indicated markers. MCT4-positive (green) cells were absent in the metaphysis (mp) but abundant in the diaphysis (dp) and secondary ossification centre (soc).
c, Maximum intensity projections of Glut1 (green) immunostaining on sections of 7 week-old tibiae. Nuclei, DAPI (blue). Note abundance of Glut1-positive cells in the diaphysis (dp) but not in the metaphyseal (mp) region below the growth plate (gp). Dashed lines indicate borders of growth plate or endosteum (es), respectively.
d, Quantitation of HIF1-α, MCT4 and Glut1 immunostaining intensities in metaphysis and diaphysis. Data represent mean±s.e.m (n=5 mice in two independent experiments). P values, two-tailed unpaired t-test.
e, Representative tile scan confocal image showing the distribution of phospho-ERK1/2 (green) immunosignal in sections of 7 week-old tibia. Nuclei, DAPI (blue). Note prominent phospho-ERK1/2 staining of cells in the metaphysis (mp) relative to the diaphysis (dp). Dashed line indicates border of the growth plate (gp).

