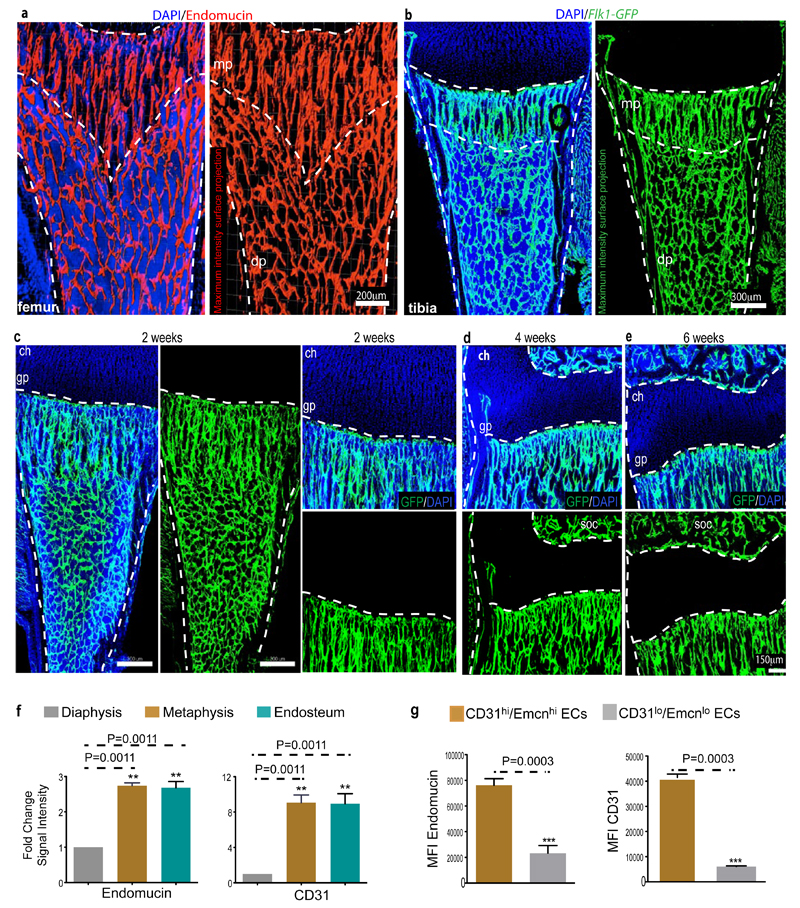
Extended Data Figure 4. Structural and marker heterogeneity in bone sinusoidal endothelium.
a, Representative tile scan confocal image showing maximum intensity surface projection of Endomucin (red) immunostaining of ECs in the femur of a 2 week-old mouse. Nuclei in left image are stained with DAPI (blue). Dashed lines indicate the adjacent growth plate (top), the border of the diaphysis (dp) and the morphologically distinct metaphyseal (mp) and diaphyseal (dp) vessels.
b, Tile scan confocal image showing maximum intensity surface projection of GFP+ ECs in 2 week-old Flk1-GFP transgenic tibia. Left: nuclei, DAPI (blue). Dashed lines indicate the adjacent growth plate (top) or the border of the diaphysis (dp). Dashed lines mark borders of the growth plate (top) and cortical bone (left and right) as well as the interface between column-like metaphyseal (mp) vessels and the highly branched diaphyseal (dp) vasculature.
c-e, Representative tile scan confocal images of the GFP+ (green) endothelium in Cdh5(PAC)-CreERT2 x Rosa26-mT/mG double transgenic tibiae from 2 week-old (c), 4 week-old (d), or 6 week-old (e) mice after postnatal tamoxifen administration. Nuclei, DAPI (blue). GFP signal is restricted to vessels and absent in chondrocytes of the growth plate (gp) or hematopoietic cells. GFP expression is restricted only to vasculature. Dashed lines indicate the borders of the growth plate, cortical bone and secondary ossification centre (soc).
f, Quantitative analysis of relative CD31 and Endomucin immunostaining intensities in the microvasculature of the metaphysis, diaphysis (marrow cavity) and endosteum, as indicated. Data represent mean±s.e.m (n=7 mice from seven independent experiments). P values, two-tailed unpaired t-test.
g, Mean fluorescence intensities (MFI) of CD31hi/Emcnhi and CD31lo/Emcnlo endothelial subsets as determined by flow cytometric analysis of bone marrow cells stained with CD31 and Endomucin. Data represent mean±s.e.m (n=7 mice two independent experiments). P values, two-tailed unpaired t-test.

