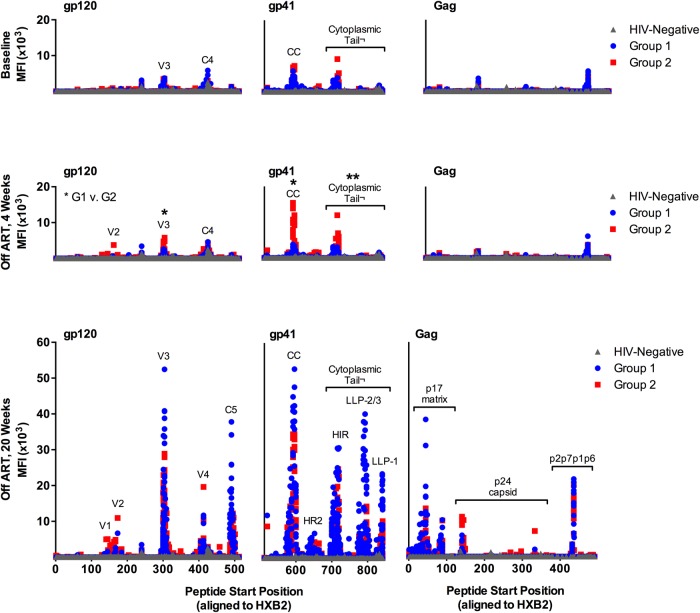
Figure 4.
Detailed immunoglobulin G (IgG) responses to linear human immunodeficiency virus (HIV)-1 peptides in HIV-infected subjects treated with antiretroviral therapy (ART) at baseline (BL), 4 weeks post-analytic treatment interruption (ATI), and 20 weeks post-ATI. Mean fluorescent intensity (MFI) of IgG binding to glycoprotein (gp)120, gp41, and Gag peptides is plotted by peptide start position (ie, peptide location on HXB2 reference strain). At 4 weeks post-ATI, Group 1 (G1) and Group 2 (G2) responses are compared to each other; *P < .05; **P < .01.

