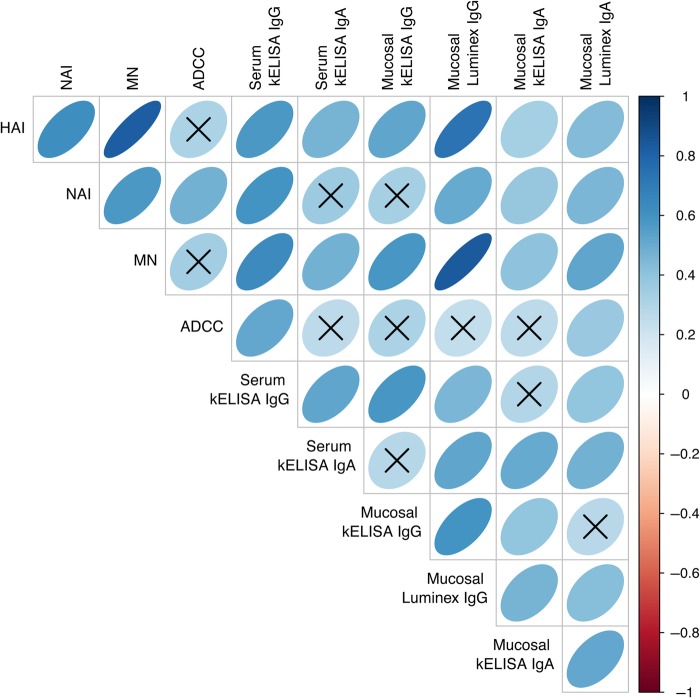
Figure 2.
Heat map representation of correlations between measurements of immune parameters. The intensity of blue and narrowness of shape indicate the strength of the correlation between measured parameters from 31 participants (93 strain-specific assays) on day 0. The vertical bar indicates the color associated with the strength of a direct correlation (blue ellipse leaning to the right) or an inverse correlation (red ellipse leaning to the left). An X through the ellipse indicates that the correlation was not significant. Data represent aggregate immune responses to all 3 influenza virus strains in the vaccine. Abbreviations: ADCC, antibody-dependent cellular cytotoxicity; HAI, hemagglutination inhibition; Ig, immunoglobulin; kELISA, kinetic enzyme-linked immunosorbent assay; MN, microneutralization; NAI, neuraminidase inhibition.

