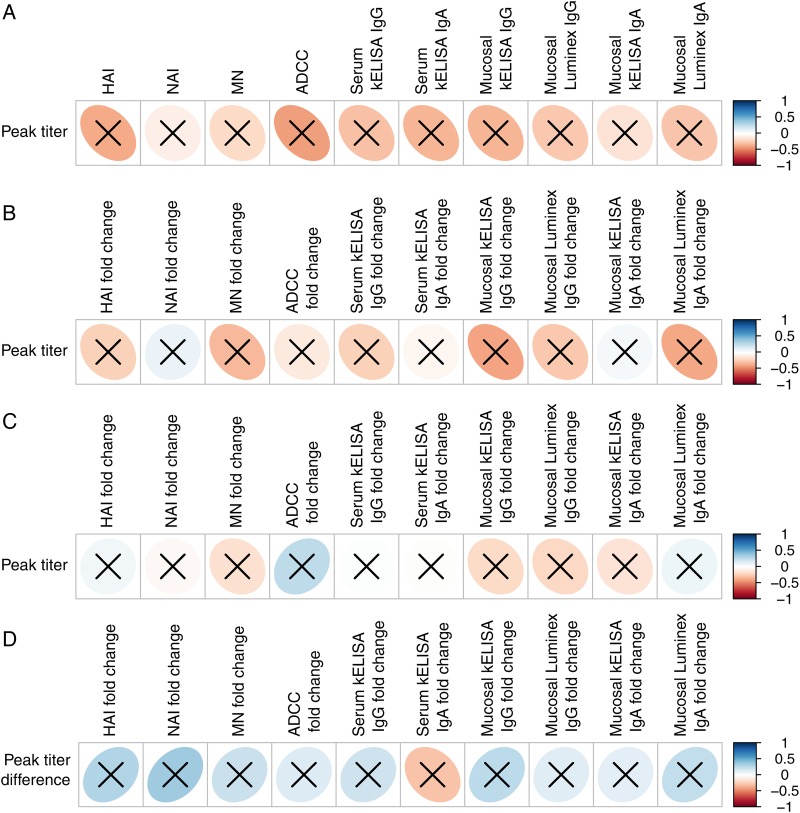
Figure 5.
(A) Correlation of immune response measured on day 0 to peak amount of live, attenuated influenza vaccine (LAIV) shed (N = 13, aggregate of 39 strain comparisons). (B) Correlation of the fold-change in LAIV immune responses measured between days 0 and 28 to the amount of virus shed on LAIV challenge (N = 11 prior recipients of LAIV, aggregate of 33 strain comparisons). (C) Correlation of the fold-change in inactivated influenza vaccine immune responses measured between days 0 and 28 to the amount of virus shed on LAIV challenge (N = 15 prior recipients of IIV, aggregate of 45 strain comparisons). (D) Correlation of the fold-change in immune response measured between days 0 and 28 to the decrease in peak virus titer between the first and second doses of LAIV (N = 11 participants, aggregate of 33 strain comparisons). The vertical bar indicates the color associated with the strength of a direct correlation (blue ellipse leaning to the right) or an inverse correlation (red ellipse leaning to the left) correlations. An X through the ellipse indicates that the correlation was not significant. Data represent aggregate immune responses to all 3 influenza virus strains in the vaccine. Abbreviations: ADCC, antibody-dependent cellular cytotoxicity; HAI, hemagglutination inhibition; kELISA, kinetic enzyme-linked immunosorbent assay; MN, microneutralization; NAI, neuraminidase inhibition.

