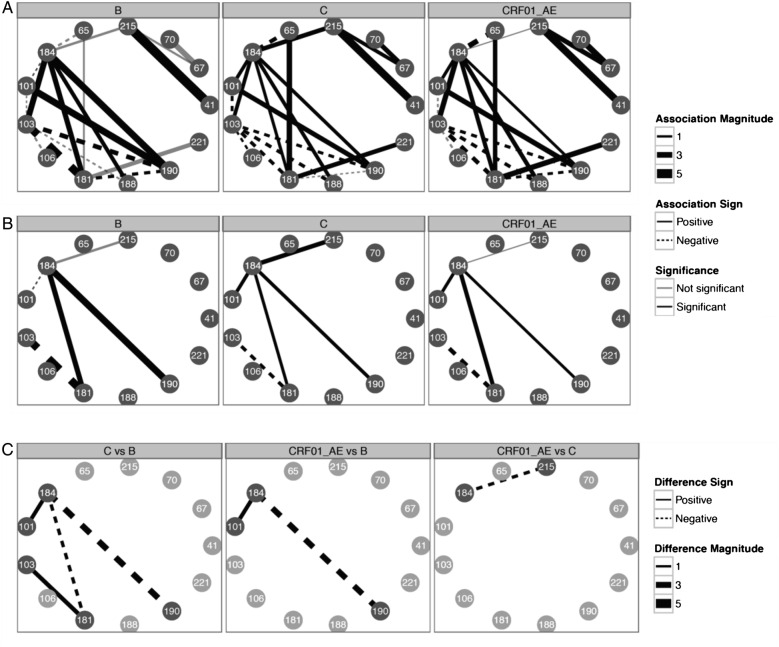
Figure 4.
The graphic illustrates the Boltzmann/Ising network model of correlation between resistance-associated positions. (A) illustrates mutation networks for subtypes B, C, and CRF01_AE. Solid edges indicate positive correlations, whereas dashed edges indicate negative correlations with varying magnitude according to line width. Black edges indicate significant correlations, whereas gray edges indicate correlations that are not significant. (B) shows resistance position networks only with edges for which correlations differ between subtypes. (C) illustrates differences in resistance position correlation between subtypes.

