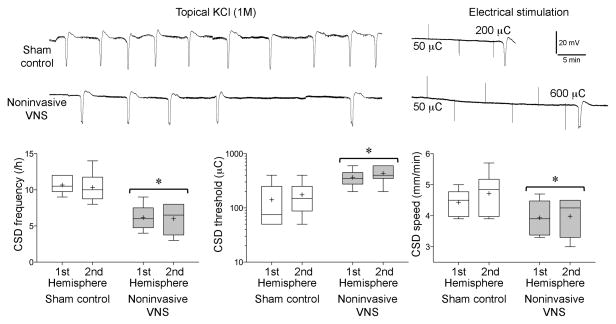
Fig. 2. Effect of nVNS on KCl-induced SD frequency, electrical SD threshold, and SD propagation speed.
Representative intracortical microelectrode recordings are provided from the second hemispheres of control and nVNS animals. Graphs show the data from the first and second hemispheres of sham control and nVNS groups (n=6 each), expressed as whisker-box plots (whisker, full range; box interquartile range; line, median, cross, mean). Note that the vertical axis of CSD threshold is in log scale. *p<0.05 vs. sham controls; two-way ANOVA for repeated measures.

