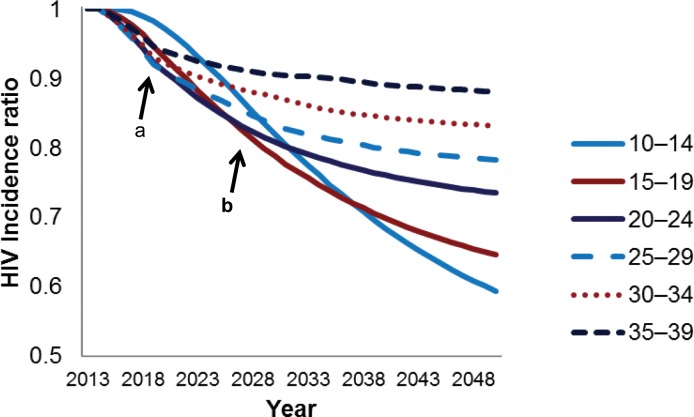
Fig 1. Reduction in HIV incidence with provision of VMMC to males, by age group, 2014–2050.
The HIV incidence ratio represents the incidence in the scale-up scenario divided by the incidence in a population where circumcision is not scaled up over baseline levels. HIV incidence is in the entire population—males and females. Each line represents the HIV incidence ratio under a scenario in which only the indicated five-year age group is circumcised. Marker a represents a five-year period from the base year (2014). Marker b represents a 15-year period from the base year.

