
Fig 1. Expression of CHST15 mRNA during the shift from inflammation to fibrosis in mouse colitis.
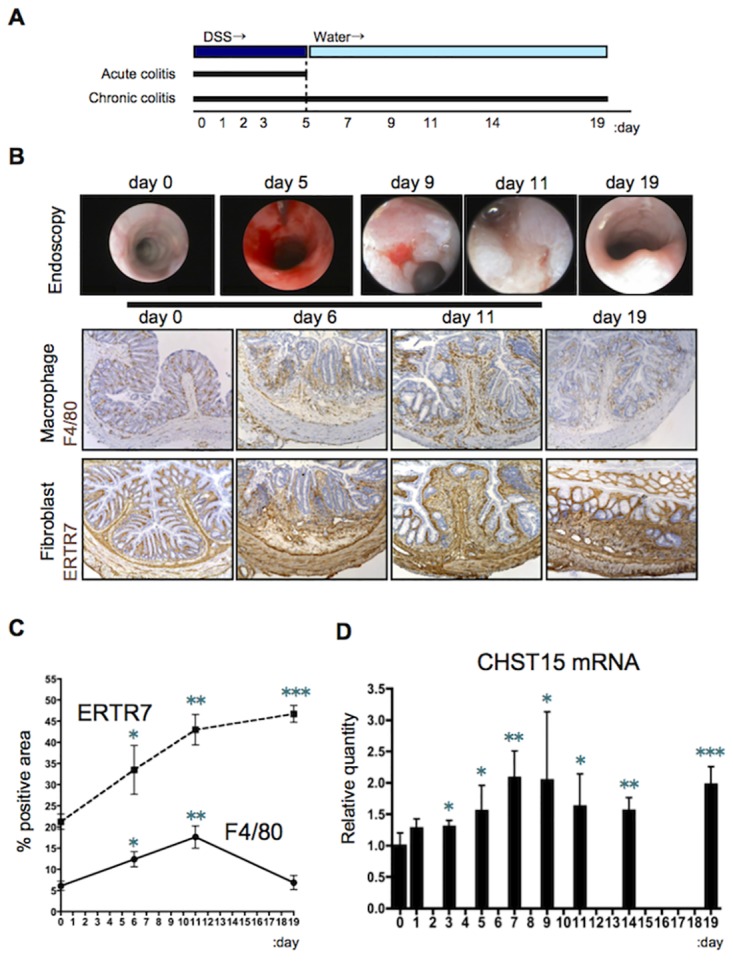
(A) Schematic representation of acute and chronic DSS colitis. (B) Endoscopic and histological findings. Representative photos of immunostaining for F4/80 and ER-TR7 (brown) in mice of disease controls (without performing siRNA injection) at indicated times are shown. Original magnification, x200. (C) Kinetics of positive area (%) for ER-TR7 (dotted line) and F4/80 (black line) of disease control mice. (D) Kinetics of CHST15 mRNA expressions in the colon of disease control mice. Results are expressed as mean ± SD (n = 4~6). *p<0.05, **p<0.01 and ***p<0.001 vs. normal mice (day 0) by Student’s t-test. Representative data were shown from 3 independent experiments.