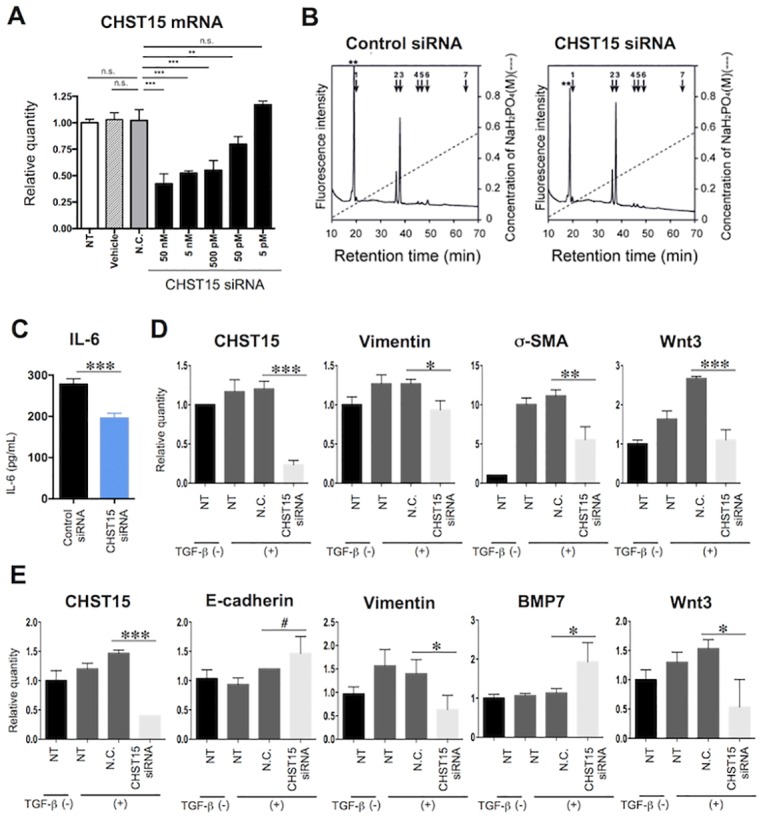
Fig 6. Suppression of activation pathways in human colonic fibroblasts in vitro by CHST15-silencing.

(A) In vitro silencing efficacy in CCD-Co18 cells. Relative quantification of CHST15 mRNA by CHST15 siRNA at concentrations of 5 pM, 50 pM, 500 pM, 5 nM and 50 nM is shown. NT; non-treated cell, Vehicle; vehicle without siRNA-treated cell, N.C.; negative control siRNA-treated cell. Statistical analyses are shown; NT (white bar) vs. N.C. (gray bar), Vehicle (dashed bar) vs. N.C. (gray), N.C. vs. graded doses of CHST15 siRNA (black). (B) Representative anion-exchange HPLC of CS fractions in conditioned medium of control siRNA- or CHST15 siRNA-treated CCD-18Co cells. The elusion positions of authentic 2AB-labeled disaccharides are indicated by bars. 1, ΔHexUA-GalNAc; 2, ΔHexUA-GalNAc(6-O-sulfate); 3, ΔHexUA-GalNAc(4-O-sulfate); 4, ΔHexUA(2-O-sulfate)-GalNAc(6-O-sulfate); 5, ΔHexUA(2-O-sulfate)-GalNAc(4-O-sulfate); 6, ΔHexUA -GalNAc(4,6-O-disulfate); 7, ΔHexUA(2-O-sulfate)-GalNAc(4,6-O-disulfate). The peaks marked by asterisks indicate the elution positions of 2-aminobenzamide-labeled ΔHexUA-GlcNAc derived from hyaluronan. ΔHexUA, GalNAc and GlcNAc represent 4,5-unsaturated hexuronic acid, N-acetylgalactosamine and N-acetylglucosamine, respectively. (C) IL-6 concentration in the above (B) conditioned medium of control siRNA- or CHST15 siRNA-treated CCD-18Co cells. ***P<0.001, Student’s t-test. (D) Effect of CHST15 siRNA on the expression of activated markers, vimentin, α-SMA and Wnt3 mRNA by TGF-ß-stimulated fibroblasts. NT; non-treated cell, N.C.; negative control siRNA-treated cell. (E) Effect of CHST15 siRNA on the expression of markers related to EMT, E-cadherin, vimentin, BMP7 and Wnt3 mRNA by TGF-ß-stimulated colon cancer cell line. NT; non-treated cell, N.C.; negative control siRNA-treated cell. Results are expressed as mean ± SD (n = 3). *p<0.05, **p<0.01 and ***p<0.001 vs. negative control siRNA treatment group by one-way ANOVA with Bonferroni multiple comparison test. #p<0.05 vs. negative control siRNA treatment group by Student’s t-test.
