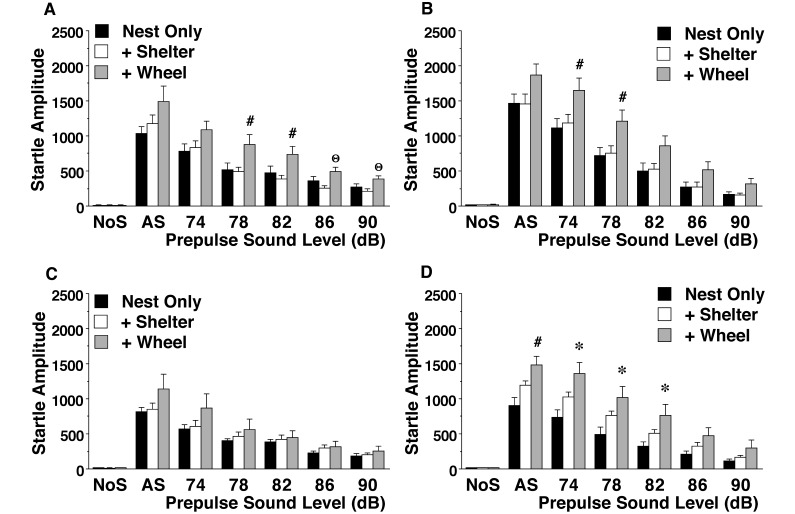
Figure 6.
Magnitude of acoustic startle responses. Trials included no-stimulus (NoS) controls and acoustic startle alone (AS; 120 dB) presentation. Data are shown as mean ± SEM. (A) Male BALB/c mice. (B) Male 129/Sv mice. (C) Female BALB/c mice. (D) Female 129/Sv mice. Value differed significantly (P < 0.05) from that for (*) the nest-only group, (Θ) the nest and shelter group, or (#) both other housing conditions.

