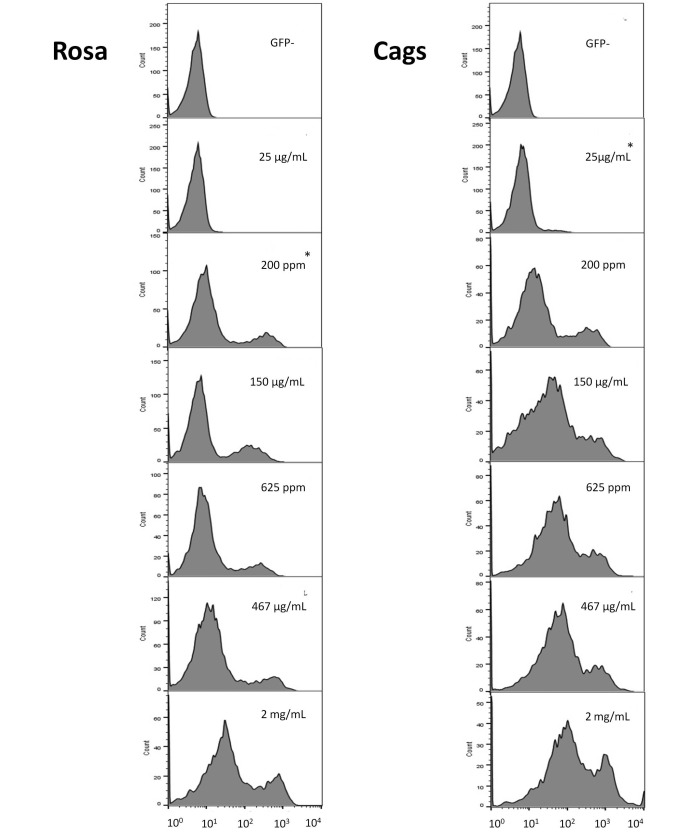
Figure 3.
The number of T cells (y axis) and the respective mean fluorescence intensity (MFI) expressed as log10 (x axis) for the Rosa (left) and Cags (right) promoters. MFI was determined by using flow cytometry and gating on the T-cell population. From top to bottom: GFP-negative population (included to show where the histogram lies in the absence of GFP expression), GFP expression at 25 µg/mL doxycycline, 200 ppm, 150 µg/mL, 625 ppm, 467 µg/mL, and 2 mg/mL. Data of a representative sample from each group on day 13 are shown. As the histogram shifts to the right, GFP expression increases. *, Lowest concentration of doxycycline that yields MFI values higher (P < 0.05) than GFP- negative controls.

