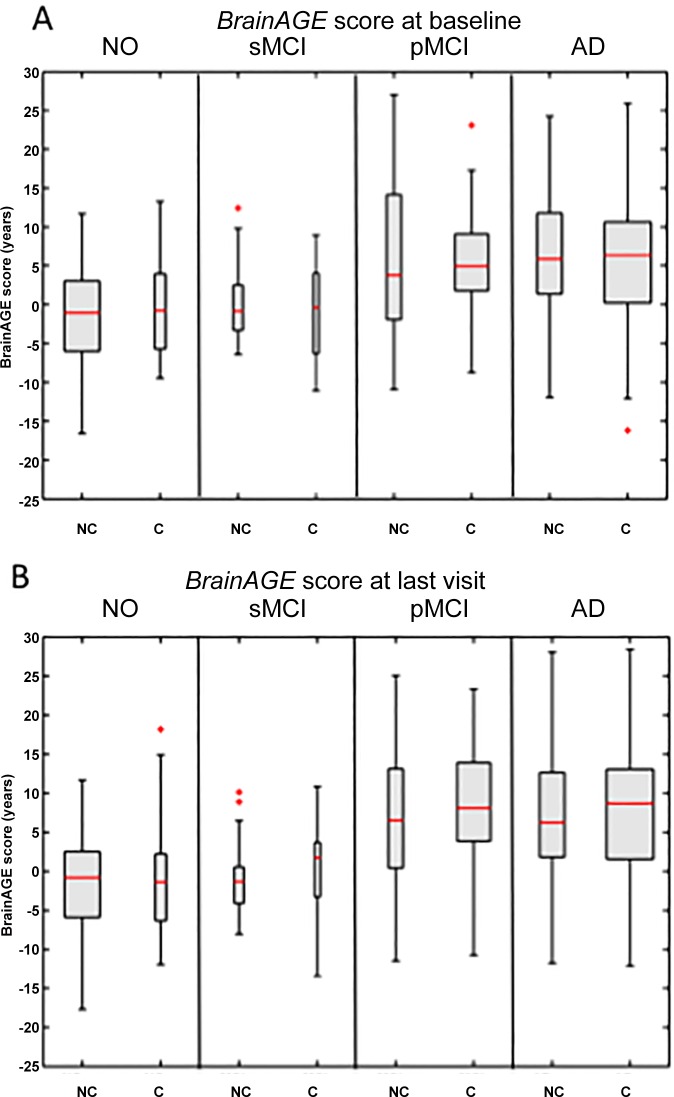
Fig 2.
BrainAGE scores at (A) baseline and (B) the last visit for non-carriers and carriers of APOE ε4. Shown are boxplots, presenting the distribution of the BrainAGE scores for the 4 diagnostic groups NO, sMCI, pMCI and AD. BrainAGE scores differed significantly between diagnostic groups at baseline (F = 18.9, p < 0.001) and at follow-up scans (F = 30.6, p < 0.001). Post-hoc tests showed significant differences between BrainAGE scores in NO as well as sMCI from BrainAGE scores in pMCI as well as AD at baseline and last visit (p < 0.05). The boxes include values between the 25th and 75th percentiles and the median (red line). Lines extending the boxes below and above include data within 1.5 times the interquartile range. All outliers are symbolized with a red”+”. Width of the boxes symbolizes group size.

