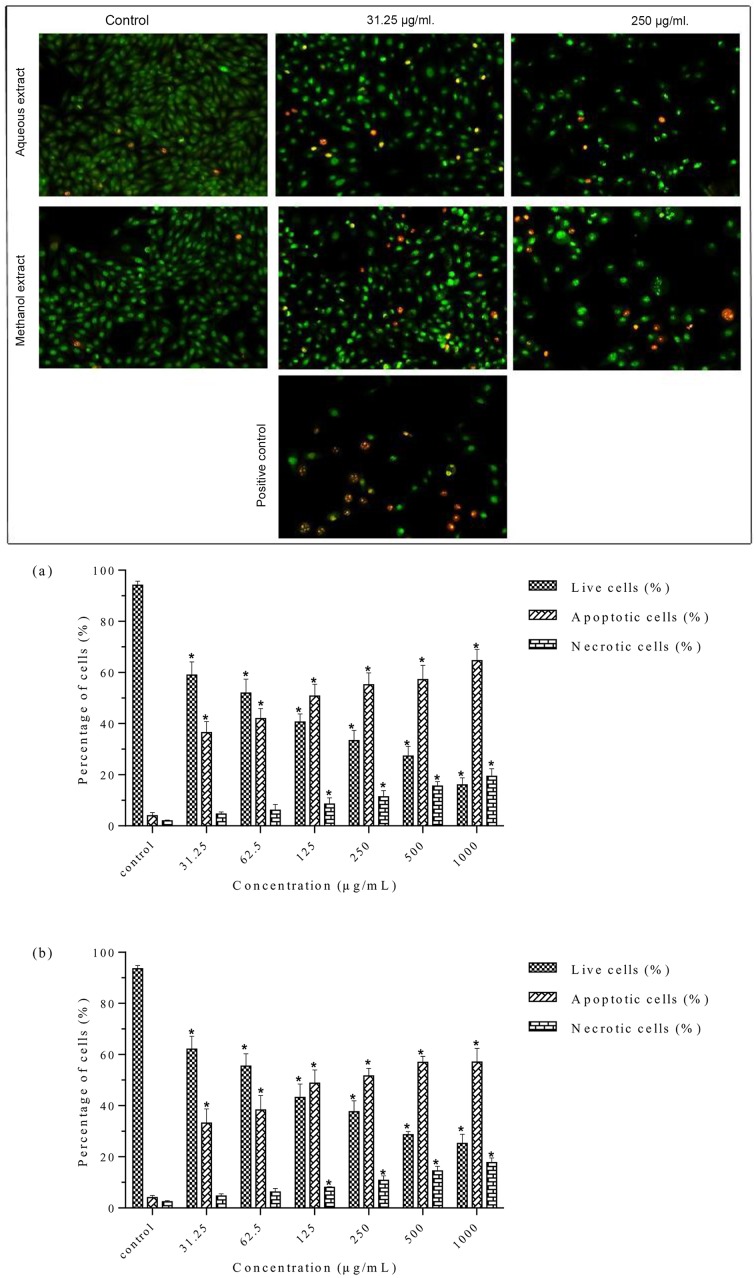
Fig 6. Morphological observation of AO/EB-stained MDA-MB-231 cells.
A. Cells incubated for 24 h with methanolic (left panel) and aqueous (right panel) extracts. Cells treated with 8.5 μg/mL tamoxifen were used as a positive control. The morphological alterations in the cells were visualized under a fluorescence microscope (magnification: 200x). Viable cells stained uniformly in green color and showed normal morphology. Treated cells showed early apoptotic cells with membrane blebbing and bright green nuclei, late apoptotic cells with fragmented and condensed orange-red nuclei, and necrotic cells with deep orange nucleus. B. The percentage of live, apoptotic, and necrotic cells at different concentration (31.25–1000 μg/mL) of (a) methanolic and (b) aqueous extracts. Data are means ± SD of triplicate in three independent experiments. A minimum of 200 cells were counted for each replicate. * indicates statistically significant difference from their respective untreated control (one-way ANOVA, P < 0.05).

