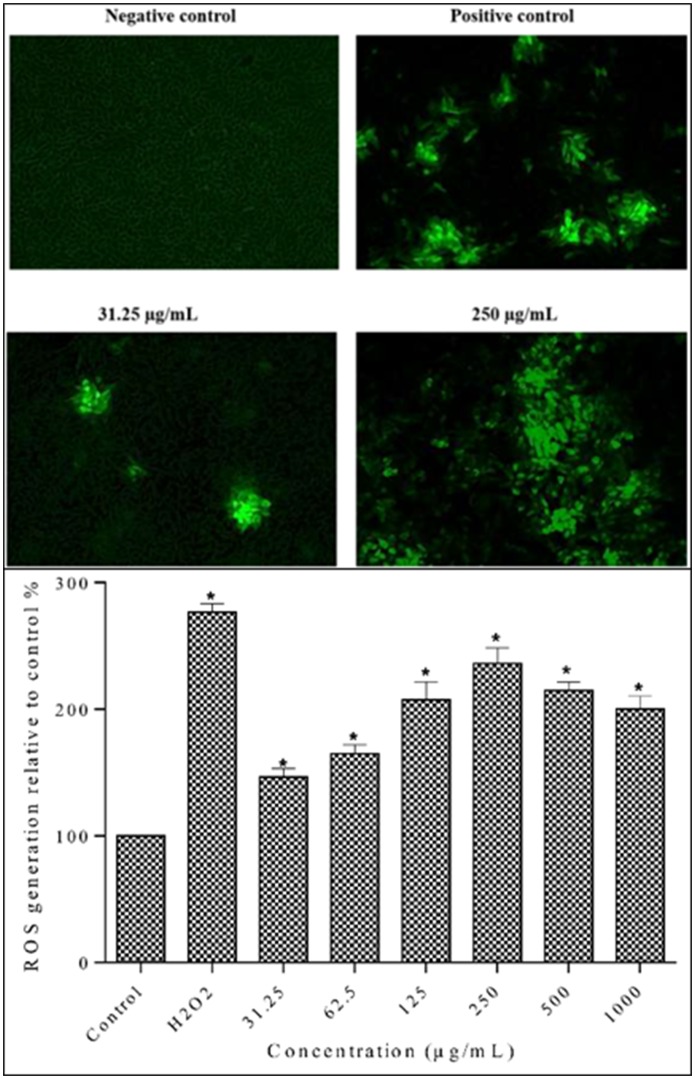
Fig 10. Evaluation of ROS generation in MDA-MB-231 cells using the fluorescent probe DCF-DA.
A. Qualitative measurement of intracellular ROS levels in MDA-MB-231 cells fluorescence images were taken at 10x magnification. Cells were treated with extracts at 31.25 μg/mL and 250 μg/mL and with positive control (50 μM H2O2) for 24 h. Fluorescence images indicated that methanolic extract induced intracellular ROS generation in MDA-MB-231 cells. B. Quantitative measurement of intracellular ROS levels in MDA-MB-231 cells. Cells were treated with different concentrations of methanolic extract and positive control (50 μM H2O2) for 12 h. Data are means ± SD of triplicate in three independent experiments. * indicates statistically significant difference from corresponding controls (one-way ANOVA, P < 0.05).

