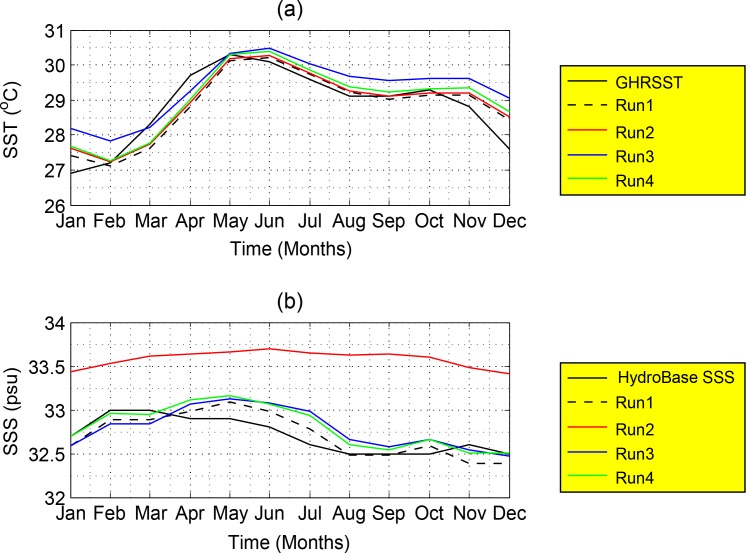
Fig 9.
The mean monthly variations of SST (°C) and SSS (psu) represented for the GHRSST and HydroBase SSS (the black lines), control run (Run1, black dashed-line), surface freshwater effect run (Run2, red line), wind stress effect run (Run3, blue line) and solar radiation effect run (Run4, green line).

