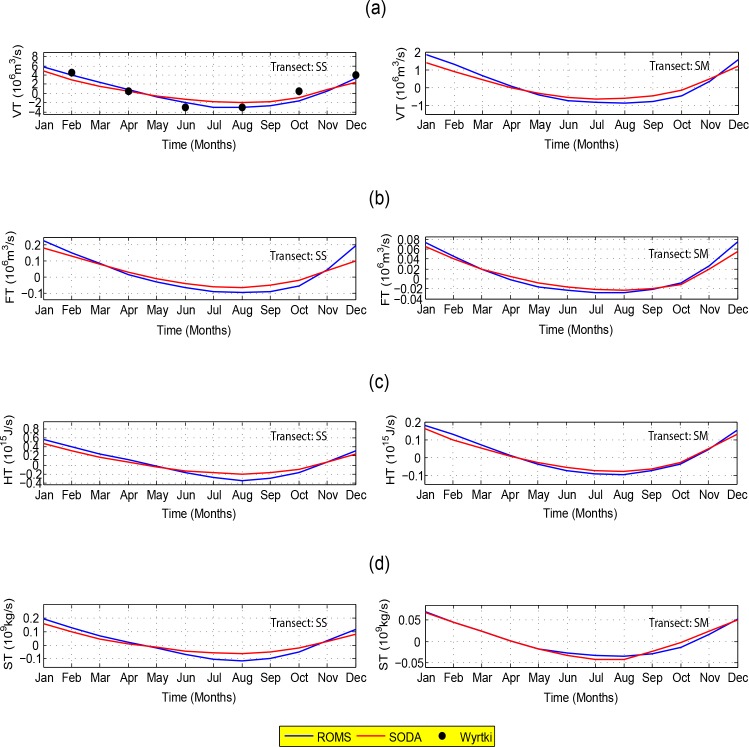
Fig 10.
Seasonal transport of (a) volume, (b) freshwater, (c) heat, and (d) salt through transects in the SS and the SM based on ROMS (the blue line) and SODA (the red line). The circles in (a) indicate the bi-monthly observed volume transport by Wyrtki, [6]. Positive and negative values indicate outflow and inflow, respectively.

