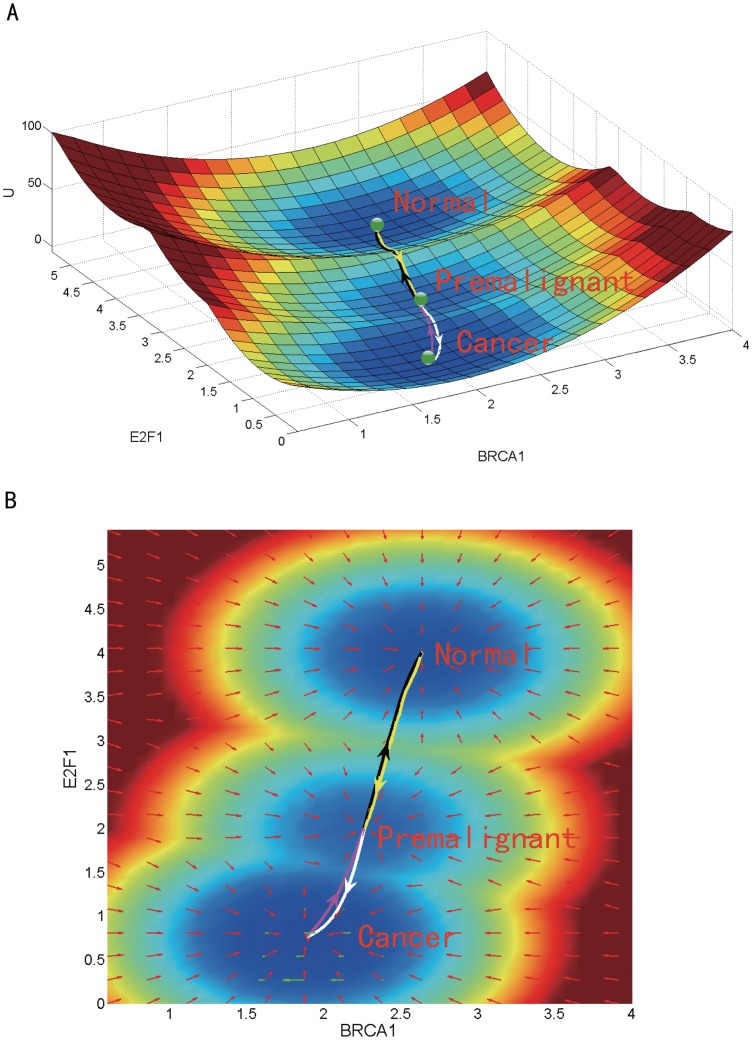
Fig 2. The tristable landscape of the breast cancer GRN.
The parameters are set as follows: the degradation constant K = 1, the activation constant a = 1, the repression constant b = 2, and the diffusion coefficient D = 0.03. (A) The three dimensional landscape and dominant kinetic paths. (B) The corresponding two dimensional landscape of the GRN. The lines in white, magenta, yellow and black represent respectively the dominant kinetic path from the premalignant to the cancer state, from the cancer to the premalignant state, from the premalignant to the normal state, and from the normal to the premalignant state. Red arrows and green arrows represent the negative gradient of the potential landscape and the probability curl flux force, respectively.

