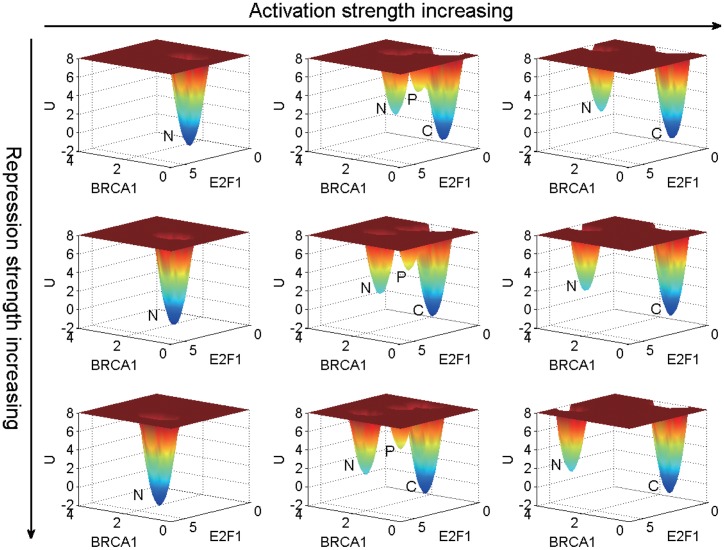
Fig 4. The landscape topography with different activation and repression strengths.
From left to right the activation parameter a is 0.5, 1 and 1.5, respectively. From top to bottom the repression parameter b is 1, 1.5 and 2, respectively. The label N, P, C represent, respectively, the normal, premalignant and cancer state. The diffusion constant D is 0.03.

