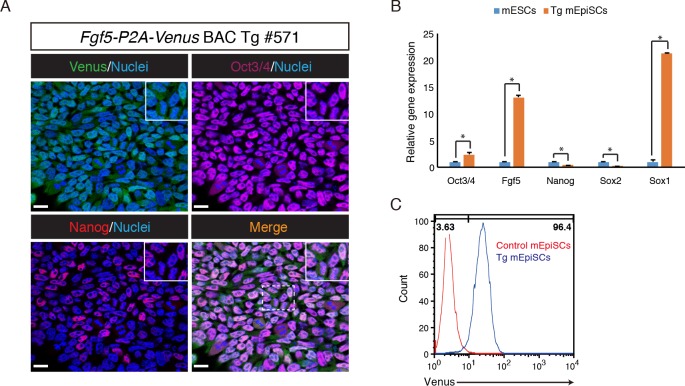
Fig 4. Derivation and characterization of Fgf5-P2A-Venus BAC Tg mEpiSCs.
(A) Immunofluorescence analysis of the Tg mEpiSCs for Venus (anti-GFP, green), Oct3/4 (purple), Nanog (red) and Nuclei (Hoechst33342, blue). Scale bar: 20 μm. All images were captured by a Leica TCS-SP8 confocal microscope using a 63x/1.4 oil objective lens. (B) RT-qPCR analysis of genes associated with pluripotency and lineage commitment in the Tg mEpiSCs and mESCs. β-actin was used as endogenous control for normalization. The mean and SD of three independent experiments are shown. *P < 0.05. (C) Venus expression in control and the Tg mEpiSCs was analyzed by flow cytometry.

