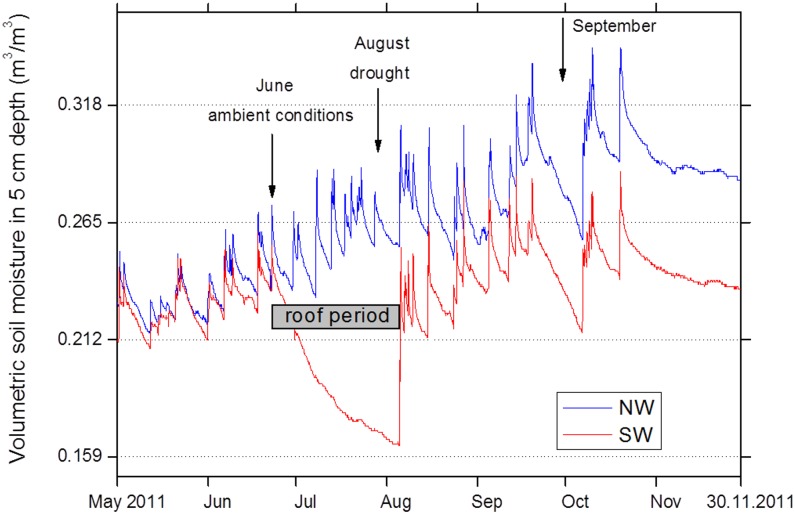
Fig 4. Dynamics of volumetric soil moisture in 5 cm depth (mean values of n = 5 measurements) in intact beech-soil-mesocosms of the control treatment (NW exposure, cool-moist microclimate) and climate change treatment (SW exposure, warm-dry microclimate) in the growing season 2011, i.e., 1 year after implementation of treatments by transferring beech seedling-soil-mesocosms within NW exposure or to SW exposure in summer 2010.
Arrows indicate sampling campaigns (see Fig 1).

