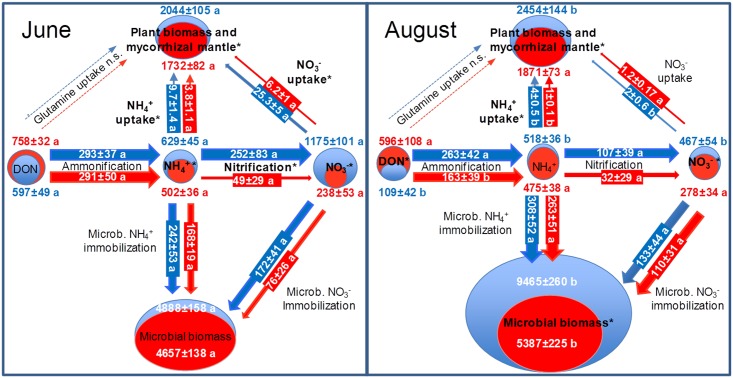
Fig 6. Gross N turnover rates (mg N m-2 day-1) (n = 8) and N pool sizes (mg N m-2) (N = 48) in intact beech seedling-soil-mesocosms.
Blue: NW exposure (control treatment); Red: SW exposure (climate change treatment). The June sampling represents the onset of the growing season after full development of leaves, while the August sampling was conducted in the middle of the growing season after 39 days of rainfall exclusion at SW. Gross rates of N turnover were calculated based on 15N tracing and pool dilution approaches following homogeneous labelling of the intact soil with double-labelled 15N/13C-glutamine, 15NH4+, or 15NO3-. Thickness of process arrows and nitrogen pool signatures is representative for respective turnover rates and pool sizes. Processes and pools significantly affected by the climate change treatment are indicated by bold letters with asterisks. Different indices show significant differences between June and August for a given treatment/exposure.

