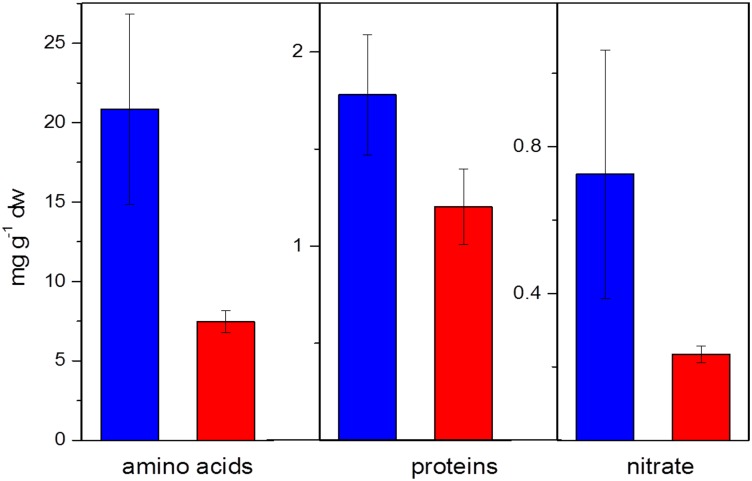
Fig 9. Metabolites (total amino acids, total soluble proteins, NO3-) extracted from fine roots of beech seedlings in June.
Blue colour represents the control treatment (NW exposure), red colour represents the climate change treatment (SW exposure). Error bars denote standard errors of the mean (n = 4 per time and treatment). Amino acid and NO3- metabolite levels were significantly lower in beech seedlings of the climate change treatment.

