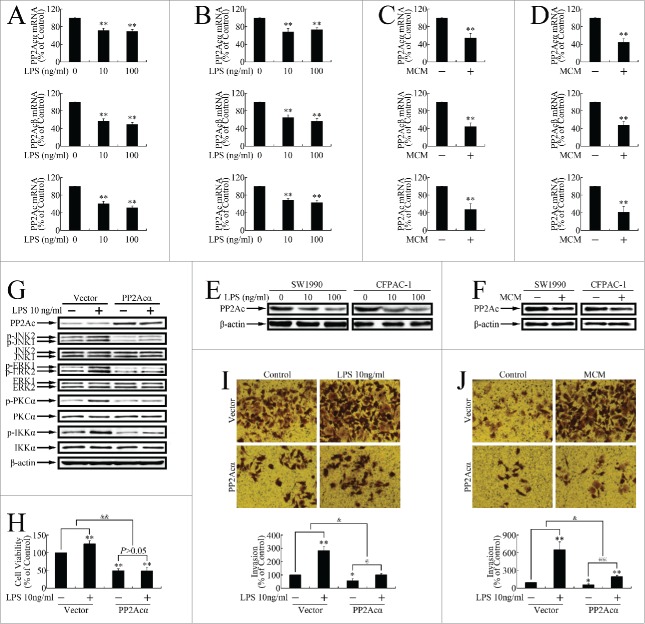
Figure 3.
Inflammatory stimuli promoted in vitro growth and metastasis by repressing PP2Ac expression in pancreatic cancer cells. (A, B) Real-time PCR determination of mRNA levels of PP2Acα, PP2Acβ, and total PP2Ac in SW1990 (A) and CFPAC-1 (B) cells incubated with LPS (0, 10, 100 ng/ml) for 24 h. **P < 0.01 as compared with control. (C, D) Real-time PCR determination of mRNA levels of PP2Acα, PP2Acβ, and total PP2Ac in SW1990 (C) and CFPAC-1 (D) cells incubated with MCM for 24 h. **P < 0.01 as compared with control. (E, F) Western blotting assessment of PP2Ac expression levels of PP2Ac after treatment with LPS (E) or MCM (F). (G) Western blot evaluation of JNK, ERK, PKC and IKK phosphorylation levels in cells transfected with pcDNA3.1(+)-PP2Acα plasmid for 24 h, and then treated with 10 ng/ml LPS for another 12 h. (H) MTT assay of cells transfected with pcDNA3.1(+)-PP2Acα plasmid for 24 h, and then incubated with MCM for an additional 120 h. **P < 0.01 as compared to control. and&P < 0.01 indicates significant differences between fold induction. (I, J) Invasion assay of SW1990 (I) and CFPAC-1 (J) cells transfected with pcDNA3.1(+)-PP2Acα plasmid for 24 h, and then treated with 10 ng/ml LPS or MCM for an additional 24 h. Cells that had migrated to the lower membranes were photographed under ×400 magnification. *P < 0.05, **P < 0.01 as compared to control. @P < 0.05, @@P < 0.01 indicate significant differences between groups. &P < 0.05 indicates significant differences between fold induction.

