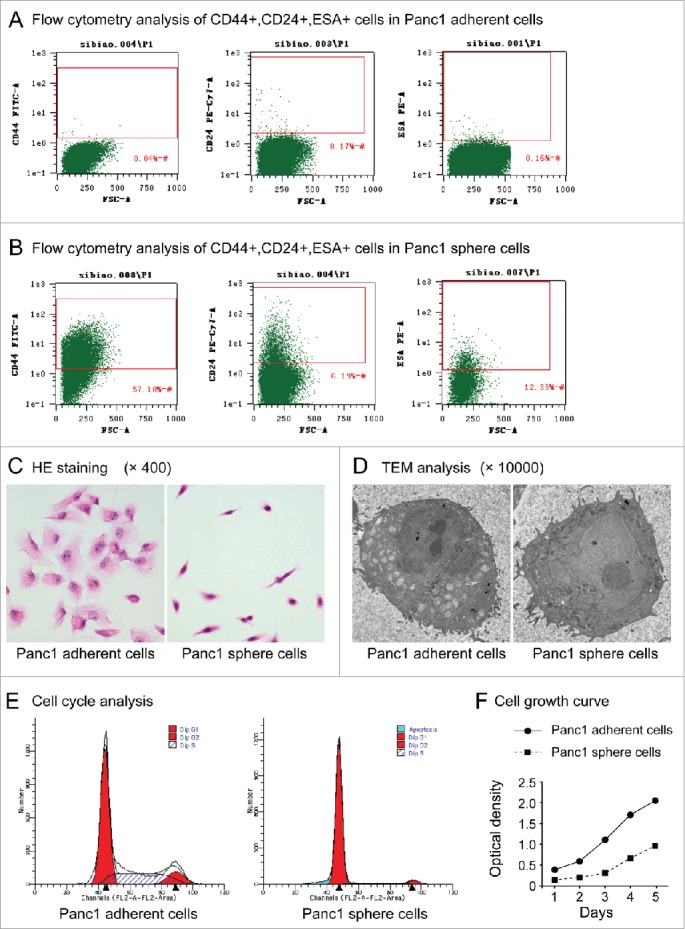
Figure 2.

(A). Flow cytometry analysis of CD44+CD24+ESA+ cells in Panc1 adherent cells. (B). Flow cytometry analysis of CD44+CD24+ESA+ cells in Panc1 sphere cells. (C). Cell morphology. After HE staining, Panc1 adherent cells had a polygonal or triangular shape, whereas Panc1 sphere cells had a circular or fusiform shape with a smaller size and a high nucleus-to-cytoplasm ratio. (D). TEM analysis. Panc1 sphere cells exhibited larger nuclei and fewer cytoplasmic organelles than Panc1 adherent cells. (E). Cell cycle. Cell cycle analysis showed that the number of Panc1 sphere cells in the G0/G1 phase was significantly higher than that of adherent Panc1 cells (91.19 ± 0.66% vs. 60.35 ± 1.37%, P < 0.001, n=3). (F). Cell proliferation. The proliferation rate of Panc1 sphere cells was significantly lower than that of Panc1 adherent cells.
