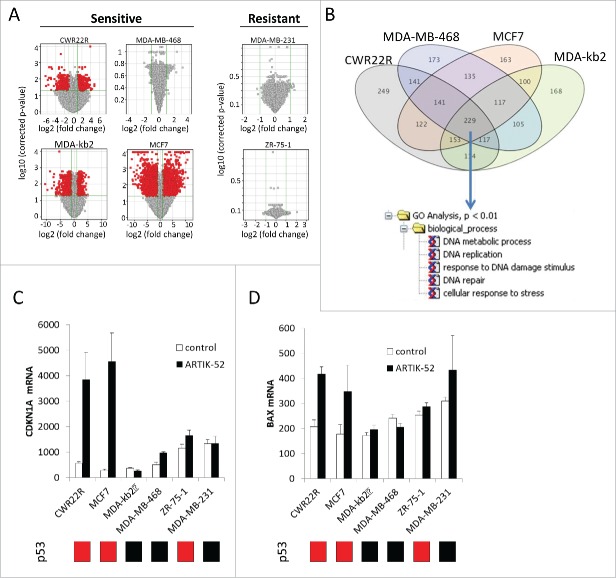
Figure 6.
Effect of ARTIK-52 treatment on gene expression in sensitive and resistant cells. A. Volcano plots demonstrating all genes which expression was changed in response to treatment with 3 μM of ARTIK-52 for 12 hours. Red dots correspond to genes which expression changed >2 times with p-value <0.05. Data of microarray hybridization analysis. B. Venn diagram showing intersection between lists of genes overexpressed in response to ARTIK-52 in all sensitive cells (>1.5). Genes common for all cells were used for Gene Ontology analysis using MetaCore software. C, D. Changes in p53 targets, CDKN1A (C) and BAX (D) mRNA levels in p53 wild type sensitive, but not resistant cells. Average normalized signal of microarray hybridization. Error bars – deviation between 3 biological replicates. Bars under plots show p53 status of the cell lines, red – wild type, black – mutant.

