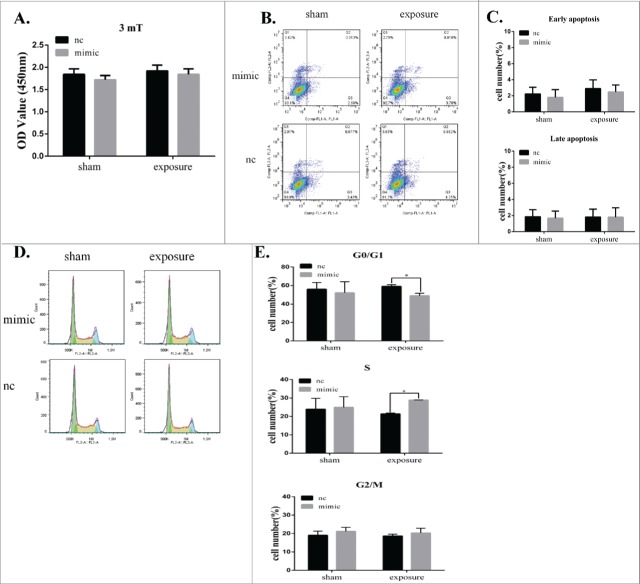
Figure 4.
MiR-26b-5p regulates the G1/S phase transition in GC-2 cells following 50 Hz ELF-EMF exposure. GC-2 cells were transfected for 6 h with a miR-26b-5p mimic and a mimic negative control and then exposed to a 50 Hz ELF-EMF at a magnetic field intensity of 3 mT. (A) The cell viability showed no significant differences between the sham and exposure groups. (B) Representative dot plots of the flow cytometry assays in GC-2 cells. (C) Quantitative analysis of apoptosis in GC-2 cells. (D) Representative results of the cell cycle analysis in GC-2 cells. (E) The percentages of the cell cycle are represented with bar graphs. The data were expressed as the mean ± SD of 3 independent experiments.

