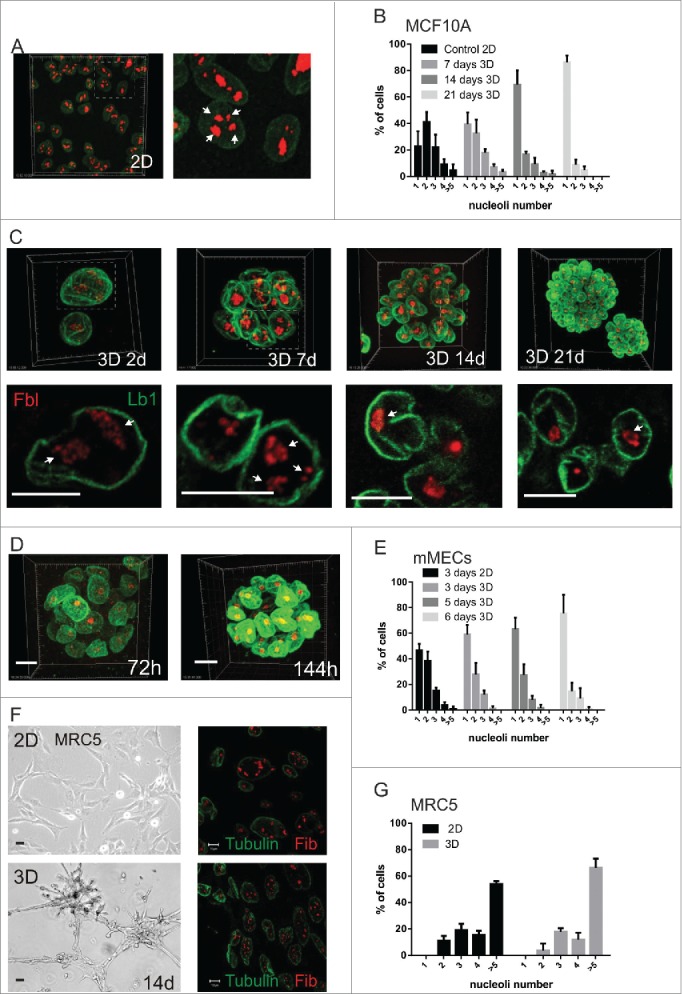
Figure 1.

Cellular microenvironment dictates the nucleolar complexity of breast epithelia (A-C) MCF10A. Representative low and high power views of cells in 2D (A) and 3D (C) stained with lamin-B1 (green) and fibrillarin (red); upper images are maximum imaging projections and lower images are high magnification views of confocal slices. The areas enlarged are shown by dotted lines and nucleoli indicated by arrows. The percentage of cells containing 1, 2, 3, 4, or >5 nucleoli in planar culture (2D n = 192 nuclei for this representative experiment from at least triplicates); or after 7, 14 and 21-d on 3D culture on LrECM (n = 172, 177, 205 respectively) are shown (B). (D, E) Primary murine MECs were grown in 3D cultures (D) and the percentage of nuclei with 1, 2, 3, 4, or >5 nucleoli determined (E); nucleoli in cells grown in 2D culture were used as a control (2D: 72-h n = 129; 3D: 72-h n = 184, 120-h n = 141, 144-h n = 129). (F, G) MRC5 diploid fibroblasts were cultured in 2D (upper panels) and 3D (lower panels) for 14-d and imaged using phase contrast (left) and confocal (right) microscopy; confocal images show fibrillarin (red) and tubulin (green) staining. While phase contrast images show that cells undergo cellular rearrangements in 3D culture (F), no difference in nucleolar number was seen when cells were grown in 2D and 3D (2D cultures n = 90, 3D cultures n = 188). Scale bars, 50 μm (phase) and10 μm (fluorescence).
