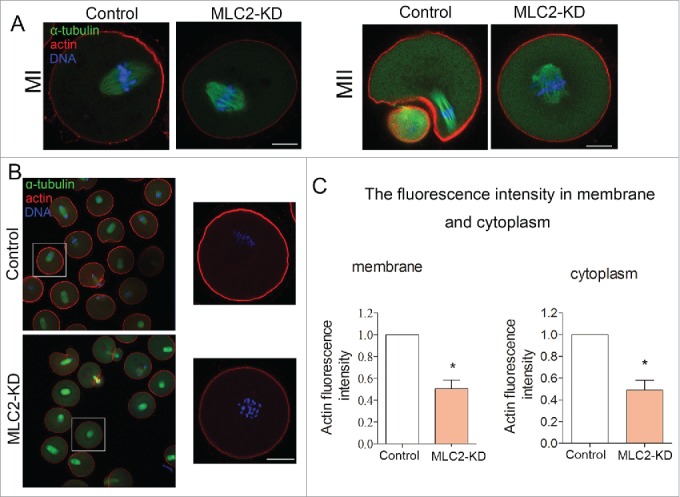
Figure 4.

Effect of MLC2 KD on actin dynamics during mouse oocyte meiosis. (A) At MI and MII stages, actin cap formed in the control group, whereas there was no actin cap formed in MLC2 KD treatment oocytes. Red, actin; Green, spindle; Blue, chromatin. Bar = 20 μm. (B) Actin expression in oocyte membrane and cytoplasm after MLC2 KD treatment. (C) Average actin fluorescence intensity in mouse oocyte membrane and cytoplasm. Red: actin; Blue: chromatin. Bar = 20 μm.*, significant difference (p < 0.05).
