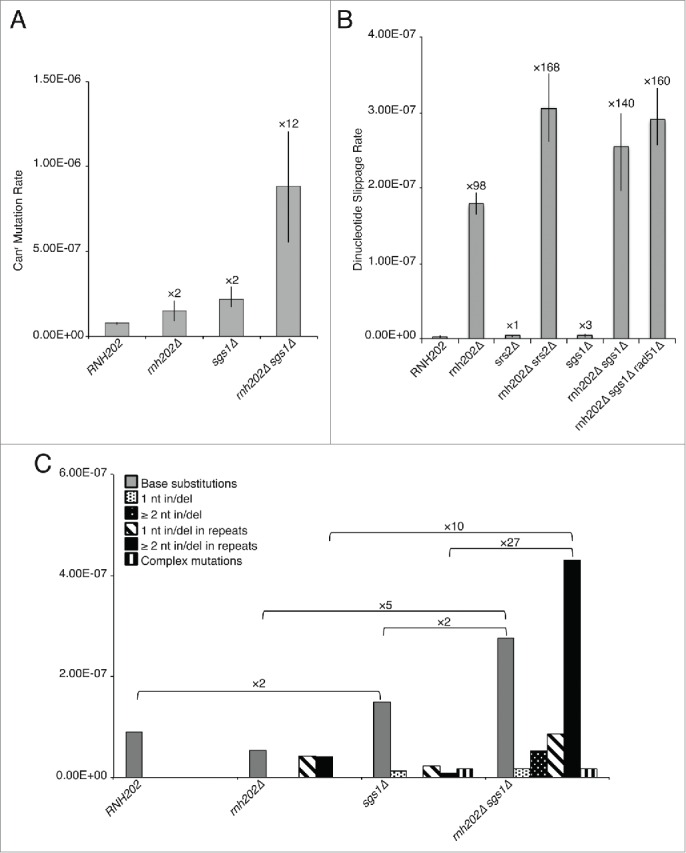
Figure 4.

Effect of SGS1 mutation in a rnh202 context on mutation. (A) Spontaneous mutation rates at the CAN1 locus are shown with the fold increase over wild type RNH202. Median rates are plotted with error bars representing 95% confidence limits (n = 18). (B) Dinucleotide slippage mutation rates are shown with the fold increase over wild type RNH202. Median rates are plotted with error bars representing 95% confidence limits (n = 18). (C) Mutation spectra of Canr mutants obtained in (A) with fold increases indicated.
