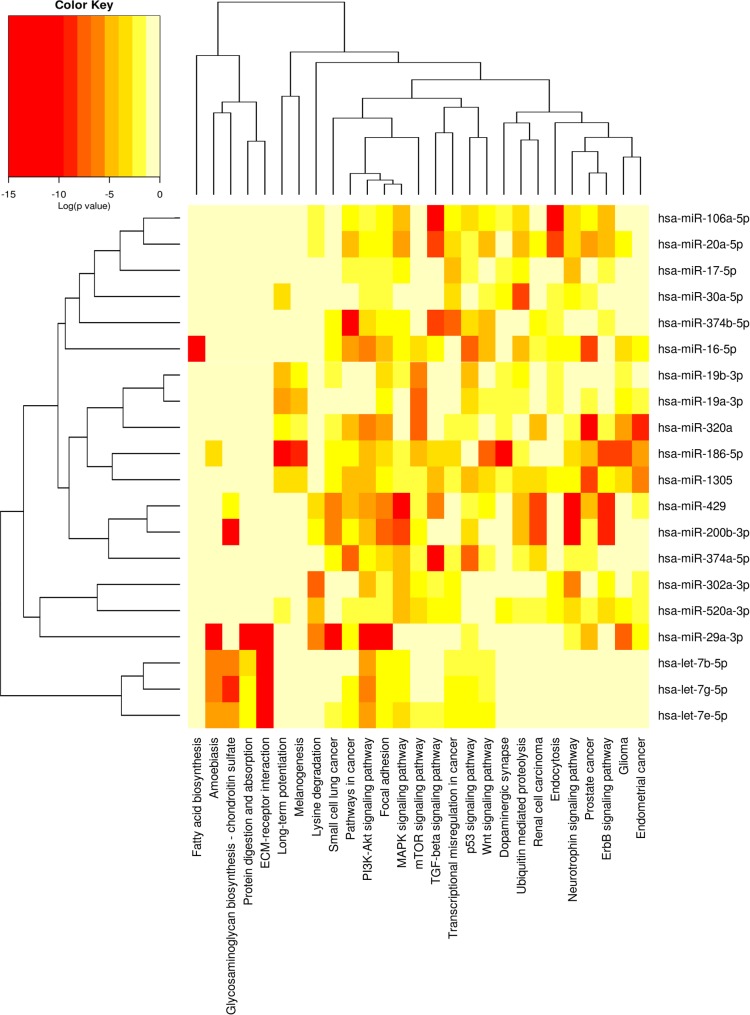
Fig 6. Heat map showing miRNAs versus pathways.
Using the option union of pathways, DIANA MirPath provided a graphical overview of pathways enriched by the 20 selected EVs-derived miRNAs. Darker colors represent lower significance values. MET-related pathways (highlighted by the circle line) are targeted by the selected miRNAs with a very low p-value (p<10−7, FDR corrected). The attached dendrograms illustrate hierarchical clustering results for miRNAs and pathways. MiRNAs that show similar pathway targeting patterns were clustered together. An analogous clustering was also performed for the biological pathways.

