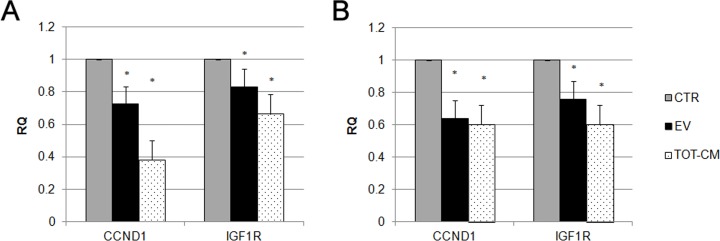
Fig 7. Analysis of miRNA predictive target genes in MSCs stimulated with EVs.
Histograms showing relative expression (RQ) of miRNA predictive target genes in MSCs, after one (A) and two weeks (B) of stimulation with EVs (black bars), or RPTEC-derived conditioned medium (TOT-CM, dotted bars), in respect to control cells (CTR, grey bars). Results are expressed as mean of six independent experiments performed in triplicate. Data were analyzed via a Student’s t test (unpaired, 2-tailed); *P<0.05 versus CTR.

