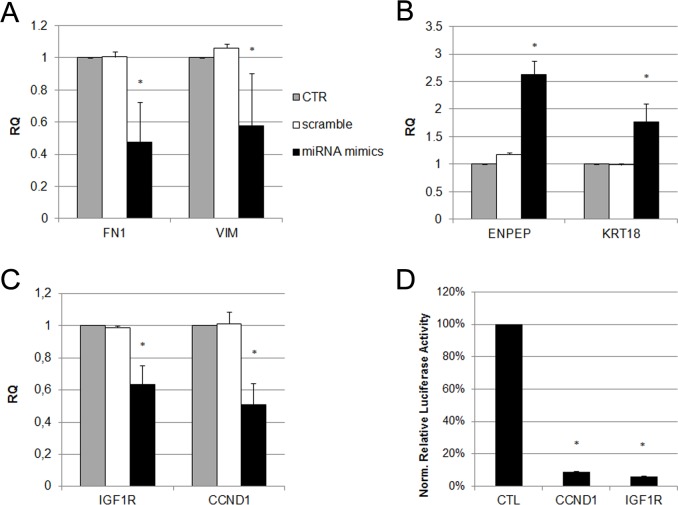
Fig 8. Analysis of mesenchymal and epithelial markers expression in MSCs transfected with miR-200 mimics.
Histograms showing relative expression (RQ) of mesenchymal markers (A), epithelial markers (B) and miRNA predictive target genes (C) in MSCs, after one week of transfection with miR-200 mimics (black bars), or with a control miRNA (scramble, white bars), in respect to control cells (CTR, grey bars). Results are expressed as mean of three independent experiments performed in triplicate. Data were analysed via a Student’s t test (unpaired, 2-tailed); *P<0.05 versus CTR. (D) Luciferase expression in HEK 293T cells following co-transfection of CCND1 or IGF1R 3’UTR reporter constructs and miR-200 family mimics for 24 hours. Firefly luciferase expression is normalized to Renilla luciferase for each gene-specific 3’UTR and presented as a percentage of the luciferase activity variation in respect to the same cells co-transfected with a negative control vector (CTR). Values are expressed as mean of three independent experiments; *P<0.05 versus CTR.

