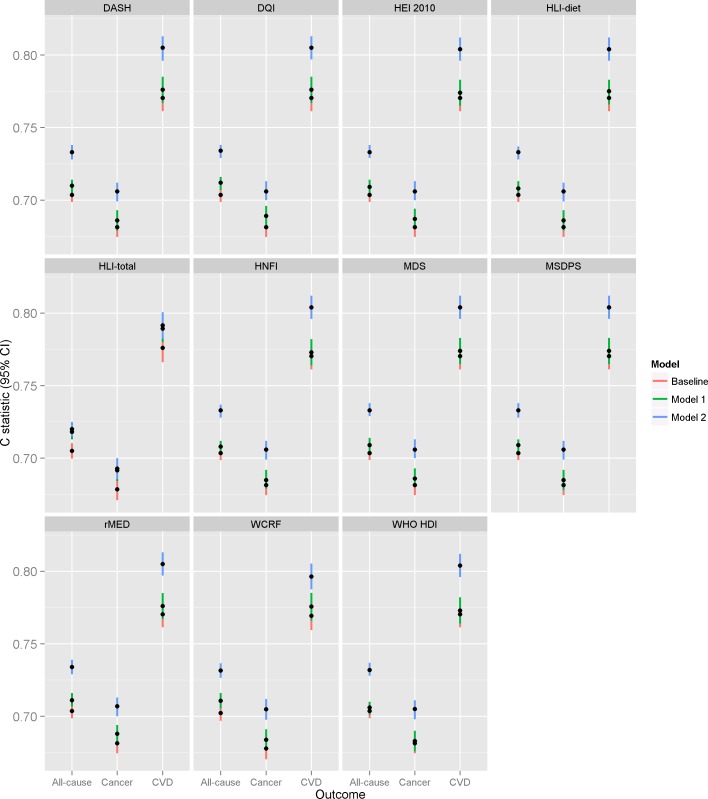
Fig 1. Discrimination (Harrell’s C statistic) of the baseline model a, Model 1 b and Model 2 c for the prediction of 10-year mortality risk in 451,256 d,e participants to the EPIC study.
Abbreviations: MDS, Mediterranean Diet Scale; rMED, relative Mediterranean diet score; MSDPS, Mediterranean Style Dietary Pattern Score; DQI-I, Diet Quality Index–International; HNFI, Healthy Nordic Food Index; HEI-2010, Healthy Eating Index 2010; WHO HDI, World Health Organization Healthy Diet Index; DASH, Dietary Approaches to Stop Hypertension; HLI, Healthy Lifestyle Index; HLI-diet, diet component of the HLI; WCRF, World Cancer Research Fund / American Institute for Cancer Research a Baseline model includes only age as a predictor, stratified by sex and center; b Model 1 = baseline + dietary score; c Model 2 = Model 1+ lifestyle factors: smoking, BMI, physical activity, educational level unless otherwise stated. d Model 2 = Model 1 + educational level because BMI, physical activity, smoking are components of the Healthy Lifestyle Index, n = 376,553. e Model 2 = Model 1 + smoking and educational level as BMI and physical activity are components of the WCRF score, n = 363,207.

